
Date: Fri, Dec 26, 2025 | 06:30 PM GMT
The broader cryptocurrency market has been navigating a period of choppy and uncertain price action over the past several weeks, a phase that began after the sharp market-wide sell-off on October 10. During that correction, Ethereum (ETH) dropped nearly 28% over the last 60 days, applying sustained pressure across the altcoin sector — including ether.fi (ETHFI).
ETHFI has mirrored this weakness, sliding more than 31% over the same period. However, despite the sharp downtrend, recent price behavior suggests selling pressure may be easing. The token is now trading near a historically significant demand zone, where buyers have repeatedly stepped in before — raising the possibility that ETHFI could be approaching an inflection point.
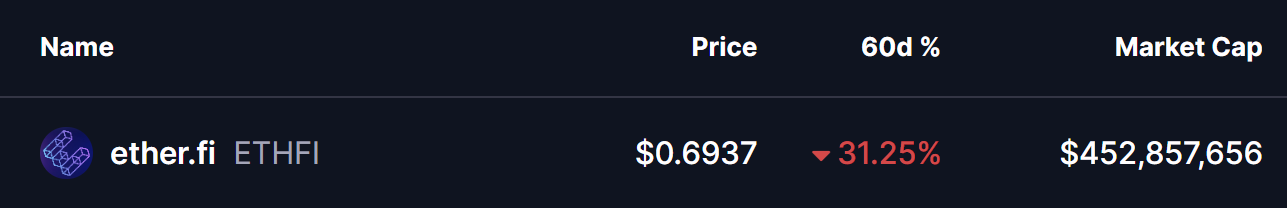
Source: Coinmarketcap
Double Bottom Pattern in Focus
On the daily timeframe, ETHFI appears to be forming a potential double-bottom structure — a classic reversal pattern that often signals exhaustion among sellers. The setup began after ETHFI was rejected from the $0.9233 resistance area, a move that triggered a sharp decline of nearly 28% and pushed price back toward the lower end of its range.
That sell-off dragged ETHFI into the $0.65 support zone, a level that has consistently acted as a strong demand area in the past. The chart now shows price revisiting this same region and stabilizing once again, suggesting buyers are actively defending it. The similarity between the first and second lows strengthens the case that a double-bottom base may be forming.
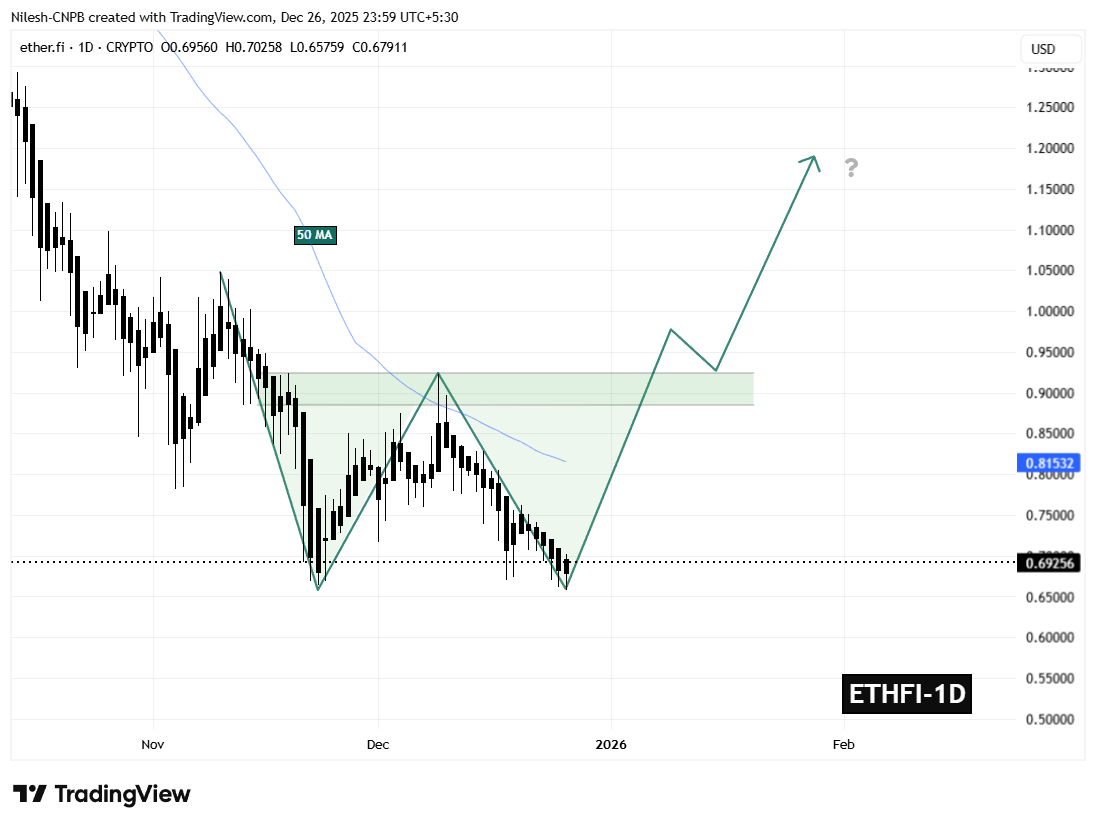
ETHFI Daily Chart/Coinsprobe (Source: Tradingview)
If this support continues to hold, the ongoing consolidation could mark the completion of the second bottom — a critical step in shifting momentum away from sellers and toward a potential trend reversal.
What’s Next for ETHFI?
The $0.65 support zone remains the most important level to monitor in the near term. As long as ETHFI holds above this area, the developing bullish structure remains valid and provides room for momentum to gradually rebuild.
On the upside, the first major challenge sits at the 50-day moving average near $0.8153. This level has repeatedly capped recovery attempts throughout the recent downtrend and now represents the initial test for buyers. A sustained move above this moving average would signal improving market structure and growing bullish confidence.
Beyond that, the $0.9233 neckline stands as the key confirmation level. A decisive breakout above this resistance would complete the double-bottom pattern and significantly strengthen the bullish outlook, potentially opening the door for a broader recovery move in the weeks ahead.
For now, ETHFI finds itself at a technically pivotal zone — one that could either reinforce the existing downtrend or mark the beginning of a meaningful rebound if buyers continue to defend support.
Disclaimer: The views and analysis presented in this article are for informational purposes only and reflect the author’s perspective, not financial advice. Technical patterns and indicators discussed are subject to market volatility and may or may not yield the anticipated results. Investors are advised to exercise caution, conduct independent research, and make decisions aligned with their individual risk tolerance.
Disclaimer: The information on this page may come from third parties and does not represent the views or opinions of Gate. The content displayed on this page is for reference only and does not constitute any financial, investment, or legal advice. Gate does not guarantee the accuracy or completeness of the information and shall not be liable for any losses arising from the use of this information. Virtual asset investments carry high risks and are subject to significant price volatility. You may lose all of your invested principal. Please fully understand the relevant risks and make prudent decisions based on your own financial situation and risk tolerance. For details, please refer to
Disclaimer.
Related Articles
River (RIVER) Price Keeps Pumping as TD Indicator Signals Another Rally
Analyst Ali Martinez highlights the accuracy of the TD Sequential indicator in predicting River (RIVER) price movements. The indicator has consistently identified significant buy and sell signals throughout RIVER's volatility, suggesting potential future trends based on current signals.
CaptainAltcoin10m ago
ETH 15-minute decline of 0.88%: Capital outflow dominates market, intensifying short-term selling pressure
On March 22, 2026, from 21:00 to 21:15 (UTC), Ethereum (ETH) recorded a -0.88% return rate within 15 minutes, with the price fluctuating in the range of 2029.54 to 2060.75 USDT, reaching an amplitude of 1.52%. Market attention has increased, short-term volatility has significantly intensified, reflecting rapid conversion of funding pressure into price pressure.
The main driver of this anomaly is accelerated capital outflows from trading platforms: approximately 420,690 USD equivalent of ETH flowed in within 10 minutes, but the number of withdrawals reached 2,319 transactions in the past 1 hour, far exceeding deposits during the same period by 5
GateNews1h ago
BTC Drops 0.58% in 15 Minutes: Tight Liquidity and Institutional Hedging Create Downward Pressure
2026-03-22 21:00 to 21:15 (UTC), BTC recorded a -0.58% return within just 15 minutes, with prices fluctuating in the range of 67562.1 to 68223.5 USDT, with an amplitude of 0.97%. During this period, market sentiment was highly tense, overall attention increased, and short-term volatility accelerated noticeably.
The main driving force behind this anomaly was the resonance formed by spot market liquidity shortage and medium-sized funds accelerating their exit. On-chain data shows a significant net outflow of -371.99 BTC in the $100k-$1M transaction range, driving selling
GateNews1h ago
Risk-Off Drips throughout Markets
Geopolitical tensions and rising uncertainty have led to a risk-off sentiment in global markets, with investors moving away from assets like Bitcoin and Ethereum. High oil prices and inflation concerns influenced portfolio adjustments, while Bitcoin selling pressure increased as short-term holders took profits. The market remains sensitive amid low sentiment.
CryptoBreaking1h ago
Bitcoin Has Stabilized, But Investors Are Paying Up for Downside Protection: VanEck
Bitcoin's volatility has decreased to around $70,000, but traders are still heavily investing in downside protection. Although premiums for puts have dropped, they remain high historically, suggesting caution among investors. This defensiveness may signal an impending price bottom, as similar market conditions in the past have led to recoveries.
Decrypt1h ago
