
Key Takeaways
-
Hyperliquid’s HIP-3 markets recorded a new all-time high daily volume of $4.83B
-
Open interest surged to a record $1.05B, up sharply from $260M last month
-
$HYPE has outperformed the broader crypto market, rising while ETH fell 24% YTD
-
The daily chart shows a Bearish Shark harmonic pattern, allowing short-term upside
-
A move toward $38.72 remains possible if momentum holds above the 50-day MA
HYPE, the native token of **Hyperliquid **— one of the fastest-growing decentralized perpetual trading platforms — has continued to show relative strength despite a broader crypto market downturn. While major assets like Ethereum (ETH) have suffered a sharp 24% decline year-to-date, HYPE has managed to stay bullish, posting over 21% gains during the same period.
This divergence has naturally caught traders’ attention. But beyond short-term price action, a deeper look into on-chain growth metrics and technical structure suggests that HYPE’s momentum may be driven by strong underlying fundamentals rather than pure speculation.
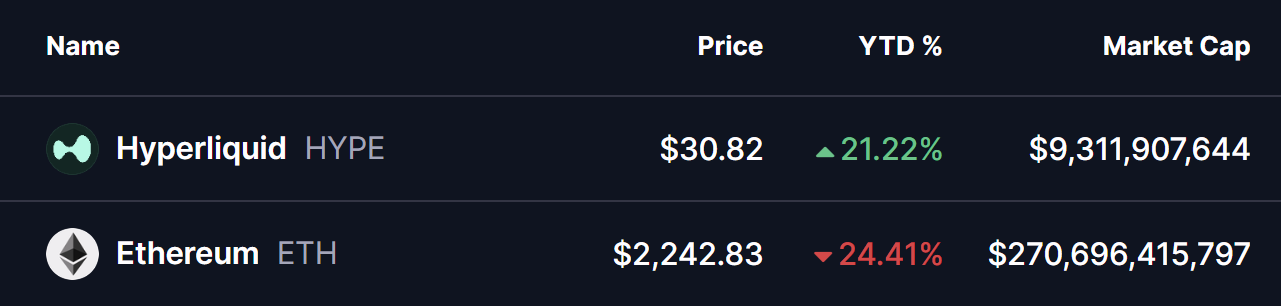
Source: Coinmarketcap
Hyperliquid’s HIP-3 Markets Hit Record Activity
According to the latest data from Flowscan, Hyperliquid’s HIP-3 protocol — launched last fall to enable permissionless on-chain markets for assets like gold, silver, and other commodities — has entered a phase of explosive growth.
Over the past week, daily trading volume across HIP-3 markets surged to approximately $4.83 billion, marking a new all-time high. At the same time, open interest (OI) climbed to a record $1.05 billion, fueled largely by rising demand for on-chain commodities exposure.
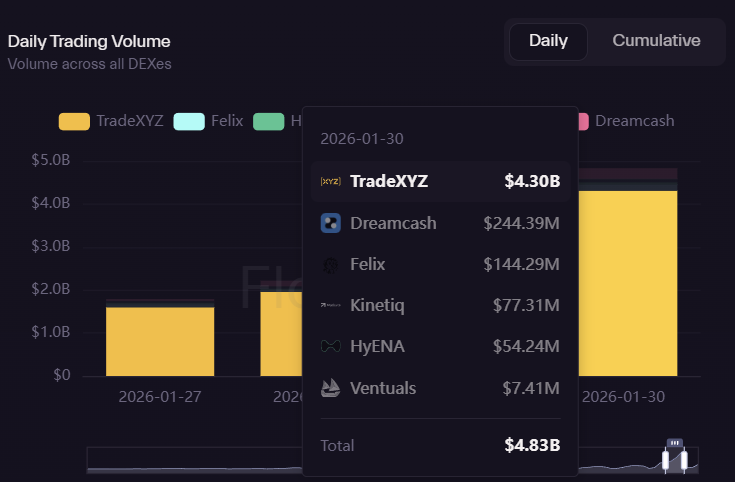
Source: Flowscan
What makes this growth particularly notable is its speed. Just a month ago, HIP-3 open interest hovered near $260 million. Since then, OI has consistently printed new weekly highs, signaling a rapid influx of capital and increasing trader participation within the Hyperliquid ecosystem.
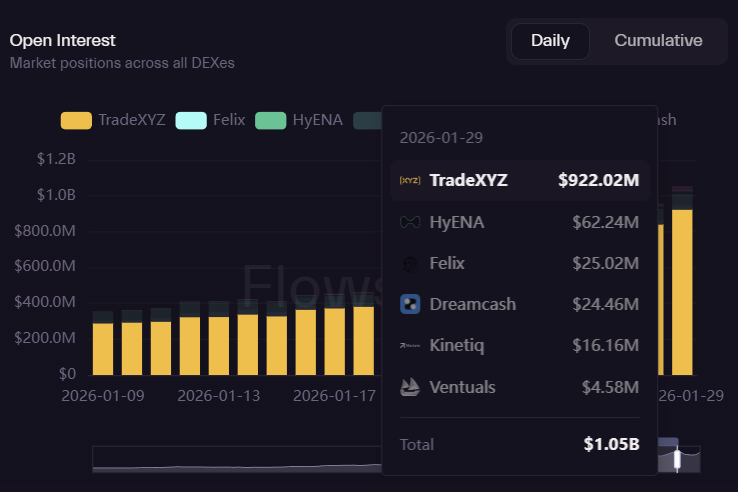
Source: Flowscan
This surge in volume and open interest reflects growing confidence in Hyperliquid’s infrastructure and execution — a dynamic that historically acts as a strong tailwind for the platform’s native token.
$HYPE Technical Structure Signals Room for Upside
From a technical standpoint, HYPE’s daily chart is forming a Bearish Shark harmonic pattern. While the name sounds ominous, this structure often appears during corrective phases and can still allow for short-term bullish continuation before a larger trend decision unfolds.
After completing the O–X–A–B leg, HYPE successfully reclaimed its 50-day moving average, a key signal that short-term momentum has shifted back in favor of buyers. Since then, price has been consolidating near the $30 region, suggesting accumulation rather than distribution.
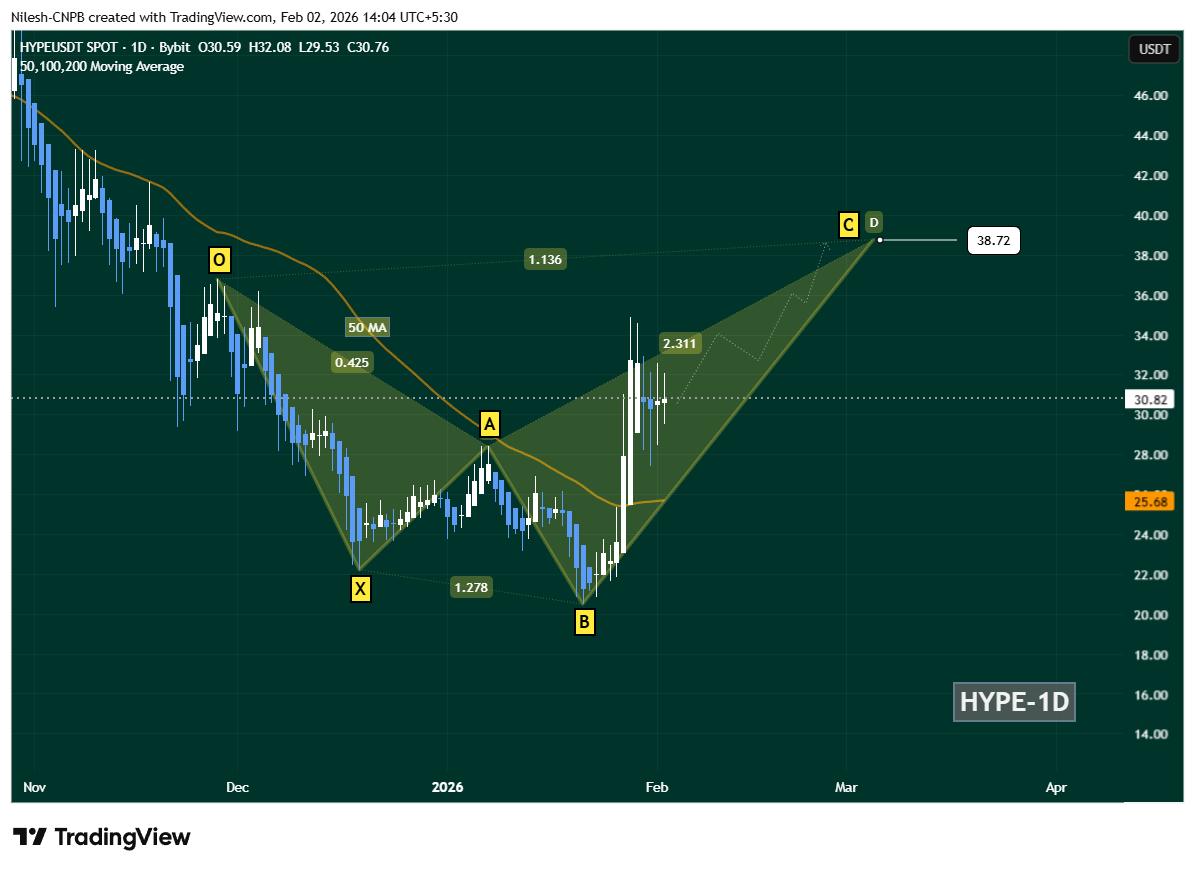
Hyperliquid (HYPE) Daily Chart/Coinsprobe (Source: Tradingview)
If current momentum holds, HYPE could continue its advance toward the C-point of the Shark pattern near $38.72. This level aligns closely with the 1.13 Fibonacci extension, a common target zone during harmonic pattern development and a logical area for the next technical reaction.
Market Outlook
With HIP-3 markets printing record volumes and open interest expanding at a rapid pace, Hyperliquid’s ecosystem growth appears firmly intact. If on-chain activity continues to scale alongside favorable technical conditions, HYPE may remain one of the stronger relative performers in the current market environment.
For now, traders will be watching whether HYPE can maintain support above the 50-day moving average and build enough momentum to challenge the $38–$40 resistance zone in the coming sessions.
Disclaimer: The views and analysis presented in this article are for informational purposes only and reflect the author’s perspective, not financial advice. Technical patterns and indicators discussed are subject to market volatility and may or may not yield the anticipated results. Investors are advised to exercise caution, conduct independent research, and make decisions aligned with their individual risk tolerance.
About Author: Nilesh Hembade is the Founder and Lead Author of Coinsprobe, with over 5 years of experience in the cryptocurrency and blockchain industry. Since launching Coinsprobe in 2023, he has been providing daily, research-driven insights through in-depth market analysis, on-chain data, and technical research.
Disclaimer: The information on this page may come from third parties and does not represent the views or opinions of Gate. The content displayed on this page is for reference only and does not constitute any financial, investment, or legal advice. Gate does not guarantee the accuracy or completeness of the information and shall not be liable for any losses arising from the use of this information. Virtual asset investments carry high risks and are subject to significant price volatility. You may lose all of your invested principal. Please fully understand the relevant risks and make prudent decisions based on your own financial situation and risk tolerance. For details, please refer to
Disclaimer.
Related Articles
Goldman Sachs has Raised Average Price Forecast for Brent Crude, Crypto Prices to be Affected?
Goldman Sachs has raised Brent Crude oil's 2026 price forecast to $85 per barrel, signaling potential inflation impacts on the crypto market, where prices have recently recovered amidst ongoing uncertainty influenced by geopolitical tensions.
TheNewsCrypto3m ago
US-Iran Tensions Ease? Trump Claims "Negotiations Bearing Fruit," Bitcoin Surges Past $71,000 Mark
As geopolitical tensions in the Middle East cool down, Bitcoin price has rebounded and broken through $70,000, primarily due to U.S. President Trump's statement that U.S.-Iran negotiations have made "productive" progress. Market risk-aversion sentiment has decreased and capital has returned to the market, providing cryptocurrency investors with some breathing room. However, experts remind investors to remain vigilant about subsequent developments in the situation.
動區BlockTempo12m ago
Bitcoin risks 50% drop as BTC’s positive correlation with US stocks grows
Bitcoin (BTC) erased much of its US-Iran war-driven gains this week, moving back in sync with the broader downtrend in risk assets, mainly US equities.
Key takeaways:
Bitcoin’s positive flip in S&P 500 correlation has historically preceded average declines of around 50% since 2018.
BTC
Cointelegraph56m ago
Impact of the Current US–Israel–Iran War on Cryptocurrency: Market Volatility, Bitcoin Trends & Future Outlook (2026)
🌍 Introduction
The ongoing geopolitical conflict involving the United States, Israel, and Iran has created shockwaves across global financial markets. From rising oil prices to falling stock indices, every asset class is being affected — including cryptocurrency.
In 2026, crypto is no
Cryptoknowmics1h ago
BTC Price Fluctuation Analysis
# BTC 2026-03-23 11:00–11:15(UTC)Price Anomaly Deep Attribution Report
## I. Executive Summary and Core Conclusions
During the time window of 2026-03-23 11:00–11:15(UTC), BTC price return was +3.51%, showing significant anomaly. This report systematically traces the causes of price anomaly through quantitative indicators including on-chain data, trading volume, position changes, and capital flows, combined with market structure and behavioral analysis. Conclusions show that this round of anomaly was primarily driven by institutional capital inflows (ETF net purchases), futures market leverage
GateNews1h ago
Crypto Market Declines As Fear Grips Investors
The crypto market is down, with a total market cap of $2.36T. Bitcoin and Ethereum have dipped by 0.82% and 2.47%, respectively. Nonetheless, some altcoins have surged significantly. DeFi TVL has decreased, while NFT sales volume has increased. Blockchain social apps are gaining traction amid geopolitical tensions.
BlockChainReporter1h ago
