
Key Takeaways
-
SKY is forming a rounding bottom pattern on the daily chart
-
Price has rebounded strongly from the $0.0419 demand zone
-
Rising volume supports improving bullish momentum
-
A breakout above $0.0778 could confirm trend reversal
-
Pattern projection points toward the $0.11 region
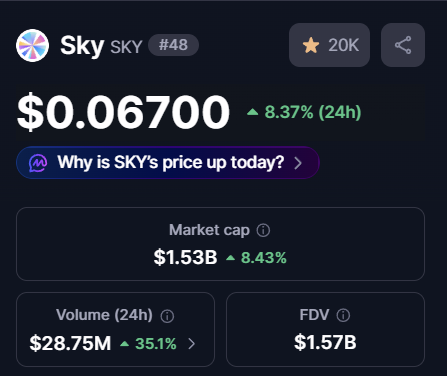
Sky (SKY), the native governance and utility token of the Sky Protocol (formerly MakerDAO), has stepped into the spotlight after posting a strong daily move of over 8%, accompanied by a sharp 35% surge in trading volume. While the short-term momentum is drawing attention, the more compelling story is unfolding on the higher timeframe chart.
Source: Coinmarketcap
Price action is now forming a classic bullish reversal structure — one that often signals the transition from prolonged weakness into a new recovery phase.
Rounding Bottom Pattern Signals Trend Shift
On the daily timeframe, SKY appears to be completing a rounding bottom formation, a well-known bullish reversal pattern that typically develops after extended downtrends. This structure reflects a gradual shift in market psychology, where persistent selling pressure slowly fades and long-term accumulation begins to dominate.
Earlier in the trend, SKY faced repeated rejection near the $0.0778 neckline resistance, which triggered a steep sell-off. That decline ultimately bottomed near $0.0419, marking a critical demand zone where buyers aggressively stepped in and prevented further downside.
Since establishing this low, price action has steadily curved higher, forming a smooth rounded base. This gradual recovery — rather than a sharp V-shaped bounce — suggests healthier accumulation rather than short-term speculation.
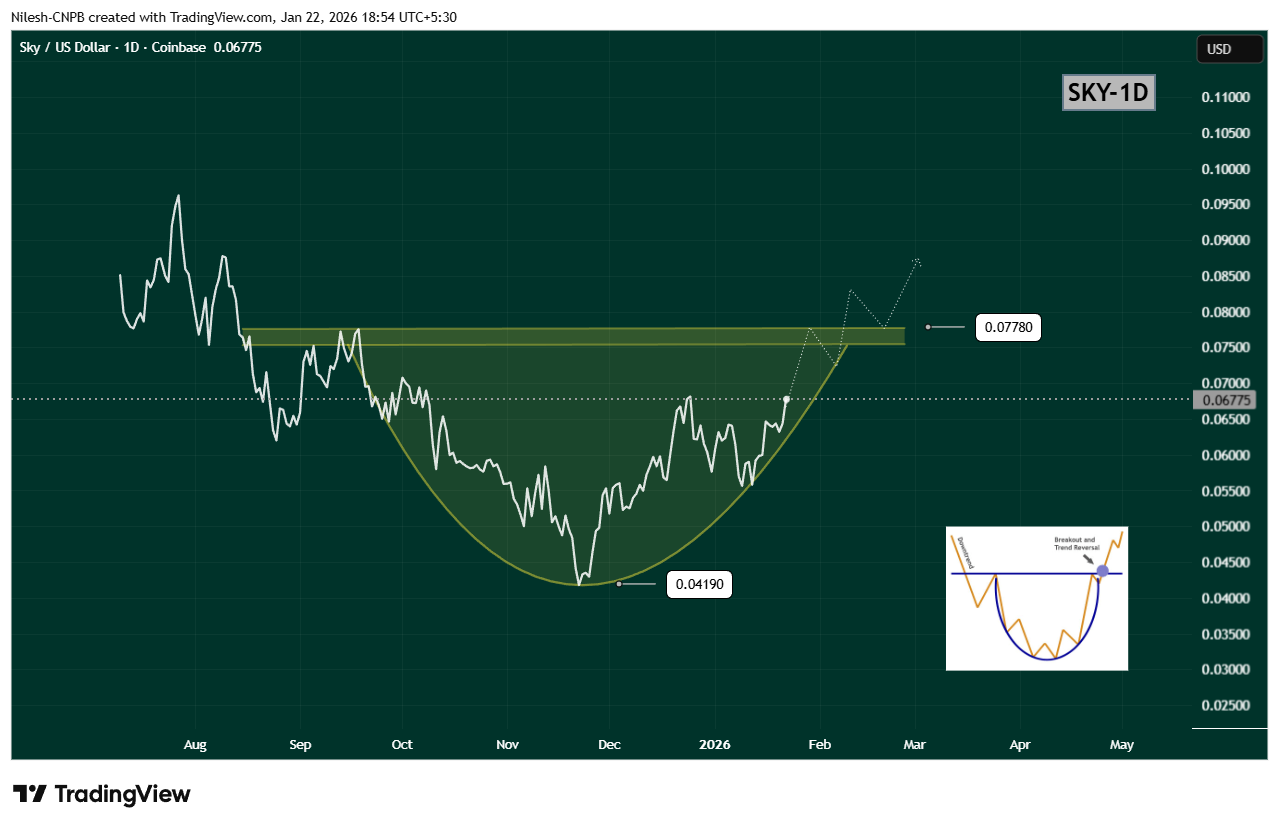
$SKY Daily Chart/Coinsprobe (Source: Tradingview)
Breakout Zone Comes Into Focus
Recent price action shows SKY reclaiming the $0.06933 region, a level that previously acted as resistance. This move strengthens the bullish structure and signals that buyers are gaining confidence ahead of a potential neckline test.
The key level to watch now is the $0.0778 resistance zone. A decisive daily close above this level would confirm the rounding bottom breakout and mark a clear shift in trend structure. Ideally, a breakout followed by a successful retest of this zone as support would further validate the bullish case.
Upside Projection and Risk Outlook
Based on the depth of the rounding bottom, the measured upside projection points toward the $0.11 region. Reaching this target would represent a potential 60–65% upside from current levels, aligning well with historical behavior of similar reversal patterns.
That said, patience remains important. Before any confirmed breakout, SKY could still experience short-term pullbacks or consolidation near the rising curve of the pattern. Such moves would not invalidate the bullish setup, as long as price continues to hold above recent higher lows.
A breakdown below the rounding base would weaken the structure, but for now, momentum favors the bulls.
Bottom Line
SKY is showing clear signs of a trend reversal in progress, with a rounding bottom pattern taking shape on the daily chart. Rising volume, improving structure, and a steady recovery toward neckline resistance all suggest that accumulation is underway.
If SKY can break and hold above $0.0778, the path opens toward the $0.11 region, signaling a broader bullish continuation. Until then, consolidation and minor pullbacks remain possible — but the overall structure is one that traders will be watching closely.
Disclaimer: The views and analysis presented in this article are for informational purposes only and reflect the author’s perspective, not financial advice. Technical patterns and indicators discussed are subject to market volatility and may or may not yield the anticipated results. Investors are advised to exercise caution, conduct independent research, and make decisions aligned with their individual risk tolerance.
About Author: Nilesh Hembade is the Founder and Lead Author of Coinsprobe, with over 5 years of experience in the cryptocurrency and blockchain industry. Since launching Coinsprobe in 2023, he has been providing daily, research-driven insights through in-depth market analysis, on-chain data, and technical research.
Disclaimer: The information on this page may come from third parties and does not represent the views or opinions of Gate. The content displayed on this page is for reference only and does not constitute any financial, investment, or legal advice. Gate does not guarantee the accuracy or completeness of the information and shall not be liable for any losses arising from the use of this information. Virtual asset investments carry high risks and are subject to significant price volatility. You may lose all of your invested principal. Please fully understand the relevant risks and make prudent decisions based on your own financial situation and risk tolerance. For details, please refer to
Disclaimer.
Related Articles
Trump "Pauses Strike on Iran" for 20 Minutes, Global Markets Surge 2.5 Trillion Dollars, BTC Surges to 71000, Liquidations of 659 Million Shake the Market
Bitcoin plummeted to a two-week low of $67,371 during the Asia session, then rapidly rebounded to $71,000 following Trump's announcement to suspend strikes against Iran, gaining 5.86%. This event triggered a $2.5 trillion increase in global market value. Meanwhile, Bitcoin liquidations reached $659 million, marking the largest scale in recent times. Market sentiment improved, the fear index rose, while miners continue to face losses pressure.
動區BlockTempo27m ago
Why Did Bitcoin Rise Today? Trump Delays Iran Attack by 5 Days, 160 Million Shorts Liquidated
Bitcoin rebounded to $71,000 following Trump's statement delaying strikes on Iran, erasing losses for the week. Easing market concerns drove a return flow to risk assets, resulting in over $160 million in forced short liquidations. Technical analysis shows the need to hold above $71,500 to confirm an uptrend. Future market direction remains influenced by geopolitical developments.
MarketWhisper49m ago
4 U.S. Economic Events That Could Shake Bitcoin This Week
Bitcoin hovers around $68,000 amid significant U.S. economic data expected to influence interest rate expectations and market risk appetite. Key indicators like PMI and unemployment claims could signal economic health, impacting Bitcoin's performance based on potential Fed policy adjustments.
TapChiBitcoin1h ago
Cryptocurrency Fear and Greed Index Rises to 11, Market Remains in Extreme Panic State
Gate News, March 24: According to Alternative.me data, the Cryptocurrency Fear and Greed Index rose to 11 today, up from 8 yesterday, but market sentiment remains in "extreme fear state."
GateNews1h ago
XRP Price Just Flashed a Hidden Macro Retest – Analysts Predict the Real Fireworks
XRP is undergoing a significant macro breakout retest, suggesting potential for a notable upward move towards $15. Analyst insights indicate bullish momentum as buyers gain strength, with a successful retest validating the bullish outlook for sustained growth.
CaptainAltcoin6h ago
