
Key Takeaways
-
Hyperliquid (HYPE) has dropped over 19% on the week, with price stabilizing near a critical demand zone.
-
The $19.22–$19.55 support area is emerging as a key level where sellers may lose control.
-
A bearish Shark harmonic pattern is forming on the daily chart, hinting at a potential rebound if support holds.
-
Strong token burns and notable whale buying are acting as a contrarian signal amid broader weakness.
-
A reclaim of the 50-day moving average near $26.39 could confirm a bullish recovery phase.
Hyperliquid’s native token, HYPE, remains under sustained selling pressure as bearish momentum continues to dominate short-term price action. As of January 21, HYPE is trading nearly 9% lower on the day, extending its weekly decline to over 19%. The token is currently hovering around the $20.65 region, an area that is quickly becoming a decisive technical battleground.
While the chart reflects heavy downside pressure, a mix of aggressive supply reduction, strategic buying, and an emerging harmonic structure is raising the question: Is a rebound quietly setting up beneath the surface?
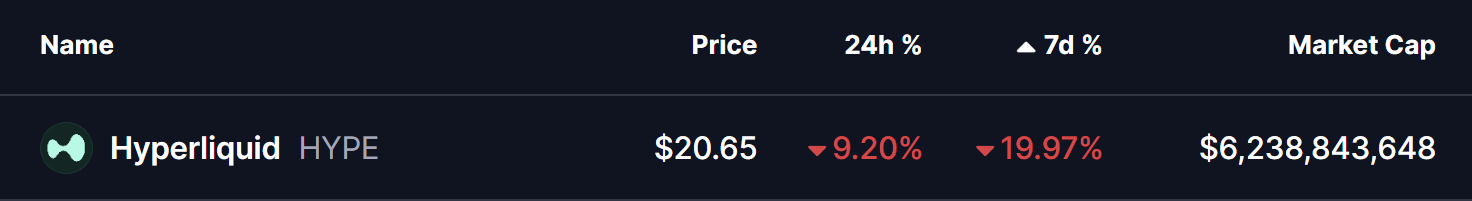
Source: Coinmarketcap
Burn and Buying Add a Contrarian Signal
Despite the ongoing price weakness, on-chain activity tells a more nuanced story.
As of January 21, Hyperliquid’s assistance fund burned 39 million HYPE tokens, permanently removing roughly 3.9% of the maximum supply from circulation. At the same time, notable buyers stepped in during the sell-off.
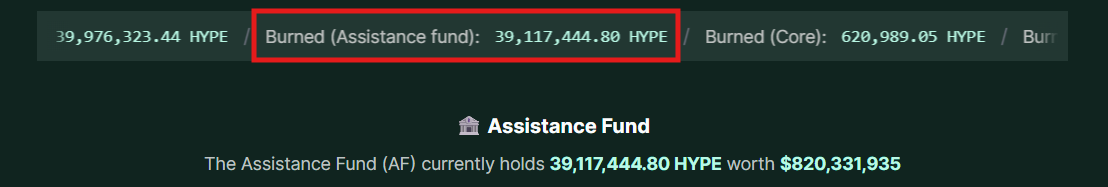
Source: hypeburn
-
Arthur Hayes reportedly purchased** 19,000 HYPE**
-
The assistance fund itself continues to buy aggressively, paying prices over 50% higher than current market levels
This combination of sustained burning and dip-buying suggests growing long-term conviction, even as short-term sentiment remains fragile.
Could This Emerging Pattern Trigger a Rebound?
From a technical perspective, the daily chart shows HYPE entering the early stages of a bearish Shark harmonic pattern.
After completing the O-X-A leg, price rolled over and is now pressing toward the projected B-point support zone between $19.22 and $19.55. This area is highlighted on the chart as a historically reactive demand zone and could mark a potential exhaustion point for sellers.
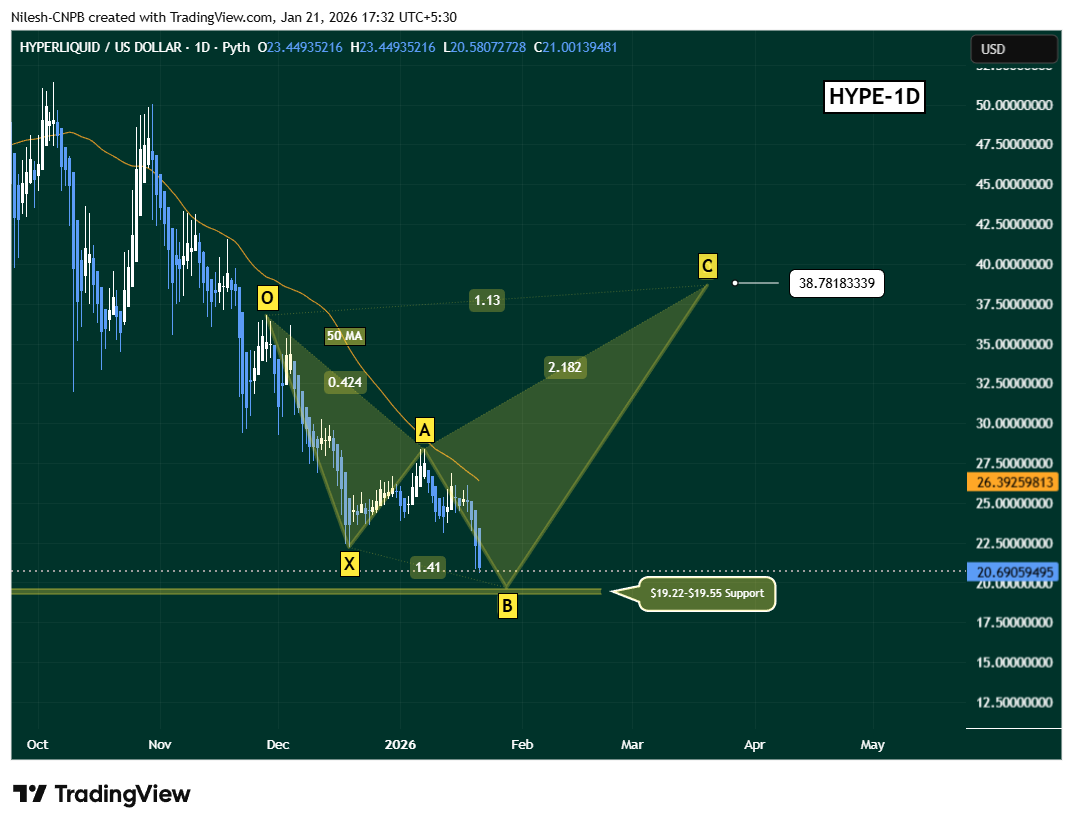
Hyperliquid (HYPE) Daily Chart/Coinsprobe (Source: Tradingview)
If buyers step in around this support and price begins to stabilize, the next key technical hurdle would be a reclaim of the 50-day moving average near $26.39. A decisive move back above this level would strengthen the rebound thesis and open the door for a recovery move toward the C-point near $38.7, where the Shark pattern’s projected extension sits around the 1.13 level.
What’s Next for HYPE?
For now, the pattern remains in development, not confirmed. The coming sessions will be critical.
-
Holding the $19.22–$19.55 zone would keep the harmonic setup alive
-
Rising volume and stronger daily closes could signal buyer commitment
-
A break back above the 50-day MA would act as early confirmation of a trend shift
On the downside, a failure to hold the lower support zone would invalidate the pattern and leave HYPE vulnerable to deeper consolidation.
For now, Hyperliquid sits at a technical inflection point, where intense selling pressure collides with supply destruction and early structural support. Whether this develops into a meaningful rebound or another leg lower will depend on how price reacts at the lower boundary in the days ahead.
Disclaimer: The views and analysis presented in this article are for informational purposes only and reflect the author’s perspective, not financial advice. Technical patterns and indicators discussed are subject to market volatility and may or may not yield the anticipated results. Investors are advised to exercise caution, conduct independent research, and make decisions aligned with their individual risk tolerance.
About Author: Nilesh Hembade is the Founder and Lead Author of Coinsprobe, with over 5 years of experience in the cryptocurrency and blockchain industry. Since launching Coinsprobe in 2023, he has been providing daily, research-driven insights through in-depth market analysis, on-chain data, and technical research.
Disclaimer: The information on this page may come from third parties and does not represent the views or opinions of Gate. The content displayed on this page is for reference only and does not constitute any financial, investment, or legal advice. Gate does not guarantee the accuracy or completeness of the information and shall not be liable for any losses arising from the use of this information. Virtual asset investments carry high risks and are subject to significant price volatility. You may lose all of your invested principal. Please fully understand the relevant risks and make prudent decisions based on your own financial situation and risk tolerance. For details, please refer to
Disclaimer.
Related Articles
ETF Absorbs Over $1.1 Billion Yet Struggles to Rescue the Market? Powell and Oil Prices Team Up to Put Pressure On, Bitcoin Breaks Key Support
Despite Bitcoin ETF inflows of $1.16 billion, Bitcoin price pulled back to $71,000, declining over 4%. Analysts attribute the pullback to interest rate expectations and inflation pressures, while ETF inflows indicate that institutions view Bitcoin as a long-term asset. The weakness in U.S. equities has also impacted the crypto market.
GateNews27m ago
XRP Today’s News: Goldman Sachs Holds 154 Million XRP in ETF, Institutional Buying Fails to Drive Up the Price
Goldman Sachs has become the largest public holder of XRP spot ETF with a position of approximately $154 million, but this institutional signal has yet to be reflected in the coin price, with XRP still hovering around $1.29. Technical analysis shows that the $1.50 support level is critical, and a breakthrough could push prices higher.
MarketWhisper1h ago
Whale Buys Million in Ethereum! Low-Level Rebound Signals Emerge, Is ETH Price Inflection Point Coming?
Recently, an Ethereum whale returned to the market, purchasing 50,706 ETH with 111 million USDT, demonstrating confidence in the current price. Meanwhile, other large wallets have exhibited similar buying behavior, elevating market attention toward Ethereum. Although Ethereum's price continues to face pressure, institutional capital inflows and improved regulatory environment in the United States provide certain support to the market, potentially establishing mid-term support levels.
GateNews1h ago
Today's cryptocurrency fear and greed index dropped to 23, with the market shifting to an extremely fearful state.
Gate News: On March 19, according to Alternative.me data, today's cryptocurrency Fear and Greed Index dropped to 23, with the market transitioning from yesterday's "panic state" (index 26) to "extreme panic state."
GateNews2h ago
Why Did Bitcoin Decline Today? Powell Sends Hawkish Signals, Trump Considers Troop Increase in Middle East
Bitcoin fell to $70,767 on March 19 following hawkish signals from Federal Reserve Chairman Powell, who warned that rising oil prices could exacerbate inflation; meanwhile, U.S. military troop reinforcements in the Middle East heightened geopolitical risks. The $70,000 level is a critical support for Bitcoin, and a break below it could accelerate further downside.
MarketWhisper2h ago
Here’s Why River (RIVER) Price Is Pumping Today
RIVER's price surged 25% to $27.54, driven by a bullish inverse head-and-shoulders breakout and increased trading volume. Analysts project further gains as traders respond to market conditions and ongoing ecosystem campaigns, indicating strong support for the price.
CaptainAltcoin6h ago
