
Key Takeaways
-
Zcash (ZEC) is trading near the $396–$397 range after losing momentum following a sharp 2025 rally.
-
The resignation of Zcash’s core development team triggered strong selling pressure and weakened market confidence.
-
The daily chart shows a descending triangle, a bearish continuation pattern signaling increasing seller control.
As of January 18, 2026,** Zcash (ZEC) **is trading around the $396–$397 range, extending its recent weakness with a nearly 2.5% drop over the last 24 hours. While the move may look modest on the surface, it reflects a broader shift in sentiment following ZEC’s explosive 2025 rally, where the privacy-focused coin surged more than 800% at its peak.
That momentum has clearly faded in early 2026, and both fundamentals and technicals are now flashing caution signals.
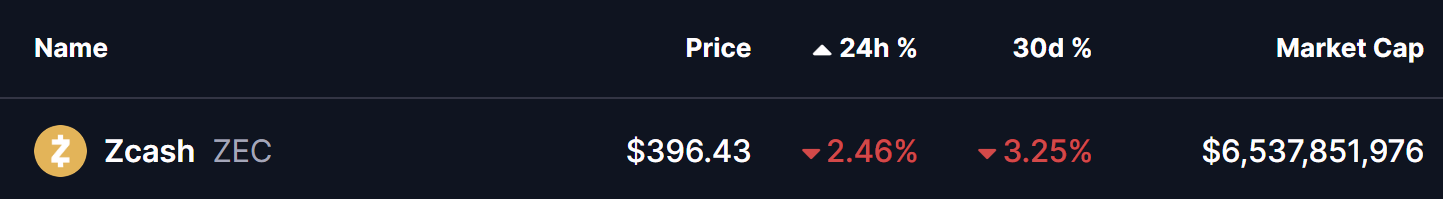
Source: Coinmarketcap
Developer Exodus Shakes Confidence
The biggest overhang for Zcash came earlier this month when the entire core development team at Electric Coin Company (ECC) stepped down. The resignations, which occurred around January 7–8, were linked to governance disputes with the Bootstrap nonprofit board overseeing the project.
Markets reacted swiftly. ZEC sold off sharply from the $480–$500 region, erasing weeks of gains in a matter of days. For a project built around long-term cryptographic research and privacy innovation, uncertainty around leadership and development direction has weighed heavily on investor confidence.
Descending Triangle Takes Shape
From a technical standpoint, Zcash’s daily chart now shows a clear descending triangle, a structure that typically signals bearish continuation after a strong uptrend.
The pattern is defined by:
-
A flat support zone between $300 and $335, which has repeatedly attracted buyers.
-
A series of lower highs, forming a downward-sloping resistance line from the 2025 peak near $750.
As price compresses within this triangle, volatility has steadily declined — often a precursor to a decisive move. Adding to the bearish bias, the 100-day moving average continues to cap upside attempts, acting as dynamic resistance during recent rebounds.
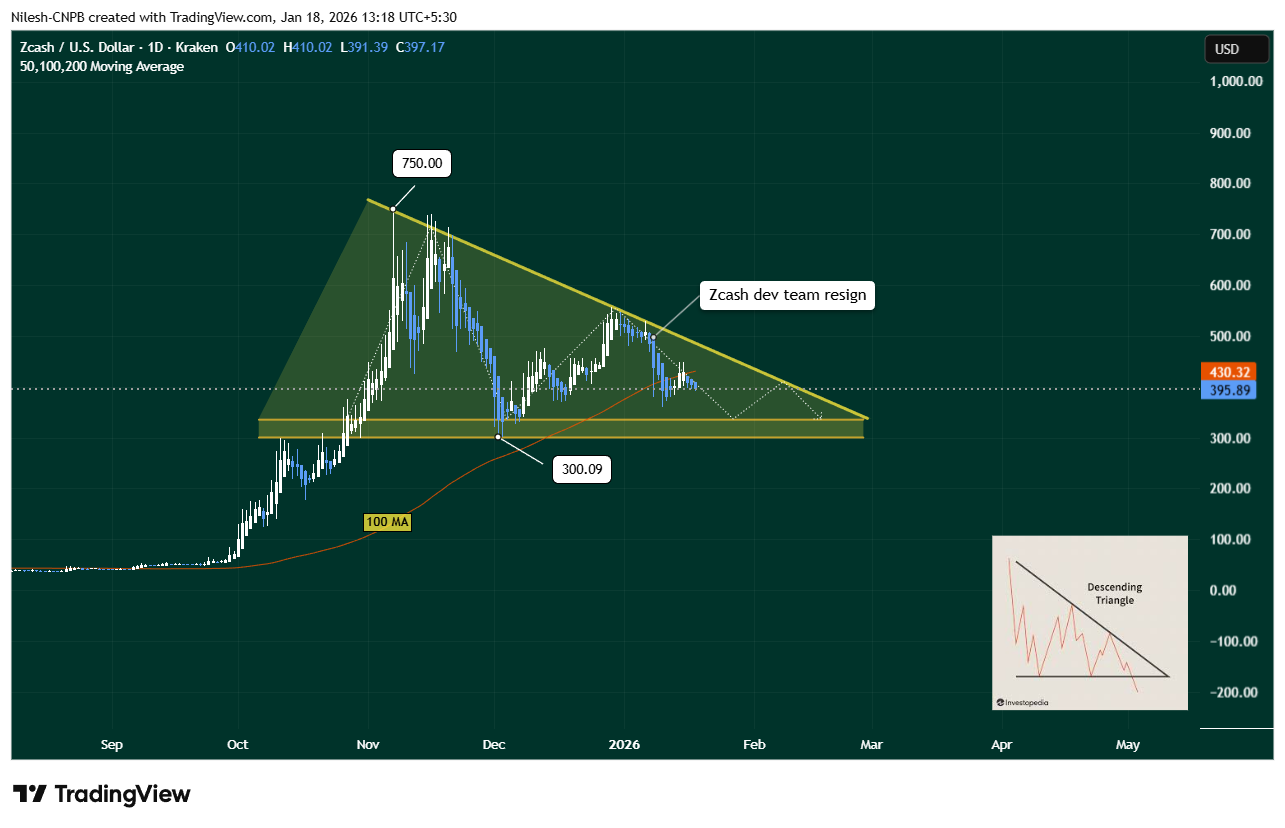
Zcash (ZEC) Daily Chart/Coinsprobe (Source: Tradingview)
The chart also highlights how the sharp sell-off began almost immediately after the developer resignation news, reinforcing the connection between fundamentals and technical weakness.
What’s Next for ZEC?
If bearish pressure persists, ZEC could gradually slide toward the lower boundary of the triangle, putting the $300–$335 support zone back in focus. A clean breakdown below this area would significantly weaken the structure and could trigger a deeper corrective phase.
On the flip side, bears would lose control if buyers manage to reclaim the 100-day moving average near $430. Such a move would signal renewed demand and could ease concerns tied to the descending triangle, at least in the short term.
Bottom Line
Zcash remains one of the most recognizable privacy-focused cryptocurrencies, but the current setup suggests caution. The combination of developer uncertainty and a bearish chart pattern has shifted momentum firmly in favor of sellers for now.
Until ZEC either breaks down from its descending triangle or reclaims key resistance levels, the token is likely to remain range-bound with a bearish tilt. How price behaves near the $300 support zone will be critical in defining Zcash’s next major move.
For traders and long-term holders alike, patience may be the best strategy as the market waits for clarity — both on the charts and within Zcash’s leadership structure.
Disclaimer: The views and analysis presented in this article are for informational purposes only and reflect the author’s perspective, not financial advice. Technical patterns and indicators discussed are subject to market volatility and may or may not yield the anticipated results. Investors are advised to exercise caution, conduct independent research, and make decisions aligned with their individual risk tolerance.
About Author: Nilesh Hembade is the Founder and Lead Author of Coinsprobe, with over 5 years of experience in the cryptocurrency and blockchain industry. Since launching Coinsprobe in 2023, he has been providing daily, research-driven insights through in-depth market analysis, on-chain data, and technical research.
Disclaimer: The information on this page may come from third parties and does not represent the views or opinions of Gate. The content displayed on this page is for reference only and does not constitute any financial, investment, or legal advice. Gate does not guarantee the accuracy or completeness of the information and shall not be liable for any losses arising from the use of this information. Virtual asset investments carry high risks and are subject to significant price volatility. You may lose all of your invested principal. Please fully understand the relevant risks and make prudent decisions based on your own financial situation and risk tolerance. For details, please refer to
Disclaimer.
Related Articles
Xinda Futures: Rising Energy Prices Constrain Rate Expectations, Gold Under Short-Term Pressure
Xinda Futures research indicates that gold price movements are influenced by rising energy prices and interest rate expectations. The Middle East conflict has kept crude oil at elevated levels, intensifying inflation concerns in the market and suppressing gold prices. The market expects the Federal Reserve to maintain interest rates unchanged, but Powell's assessment will impact subsequent policy decisions.
GateNews1h ago
Iran Bombs Israel "Nuclear Facility Surroundings" for First Time, No Nuclear Leakage So Far, But Terrorist Retaliation Cycle May Escalate
Iran launched a missile attack targeting around the Israeli nuclear research center late on March 21, causing at least 7 people to be seriously injured and 64 hospitalized. Israel's missile defense system was unable to fully intercept the missiles, worsening the tense situation. This attack is seen as retaliation for Israel's bombing of Iranian nuclear facilities, and geopolitical tensions continue to rise. The United Nations has stated that there are currently no radiation anomalies, but the risk still exists.
動區BlockTempo1h ago
Trump Issues Ultimatum: Iran Must Open Strait of Hormuz Within 48 Hours "Or We'll Bomb Power Plants," Bitcoin Plummets to 68,000
Trump issued a 48-hour ultimatum this morning (22nd) demanding Iran fully open the Strait of Hormuz, otherwise the U.S. military will destroy Iran's power plants; following the announcement, Bitcoin plummeted rapidly to $68,000, with the Fear and Greed Index dropping to 9, indicating extreme market panic.
(Background: Iran launched medium-range missiles at U.S. and British bases, missing but with a range of 4,000 kilometers, "double what intelligence estimated")
(Context: Lai Ching-te approved: Nuclear Plants 2 and 3 "have conditions for restart," Taiwan's power shortage in the AI era cannot be sustained)
Contents of this article
Toggle
Middle East conflict has been burning for over 4 weeks
Bitcoin crashes to $68,000, liquidations of $236 million
48-hour countdown, market awaits three answers
U.S. President Trump posted on his social media platform Truth Social at 7:44 AM this morning (22nd)
動區BlockTempo2h ago
RIVER surges 25% in one day: Will the uptrend continue?
RIVER has surged by 25% in 24 hours, with a 11% increase over the past week, driven by speculative trading and a 42% rise in open interest. Despite this, actual market demand remains weak, suggesting a possibility of upcoming corrections.
TapChiBitcoin4h ago
Today's cryptocurrency fear and greed index dropped to 10, still in extreme panic state
Gate News reports that on March 22, according to data from Alternative.me, the cryptocurrency fear and greed index dropped to 10, continuing its decline from yesterday's 12, and the market remains in a state of "extreme fear."
GateNews4h ago
Shiba Inu (SHIB) Sees Shorts Exit in 4 Hours While Price Eyes Recovery - U.Today
Shiba Inu's price fluctuated recently, rising to $0.00000622 before falling below the daily MA 50 at $0.00000604. Despite brief liquidations of short positions, long traders faced larger losses. Open interest in SHIB increased by 14.31%, indicating a growing trust in its potential rise amidst market uncertainties.
UToday5h ago
