
Key Takeaways
-
OriginTrail (TRAC) has surged around 12% in a single day, drawing renewed attention to the token.
-
TRAC has broken out from an ascending triangle near $0.46 on the daily chart, signaling growing bullish momentum.
-
Similar breakout structures in July and October 2025 previously led to strong rallies of 63% and 113%.
-
Holding the $0.44–$0.46 zone as support will be crucial to keep the bullish fractal setup intact.
-
If the pattern plays out, TRAC could attempt a move toward its long-term ascending resistance above $1.00.
OriginTrail, the decentralized knowledge graph protocol, is stepping back into the spotlight as its native token TRAC records a strong 12% daily surge. Beyond the price jump, the real signal is coming from the charts, where a familiar fractal breakout structure is starting to emerge on the daily timeframe, hinting that a larger upside move could be forming.
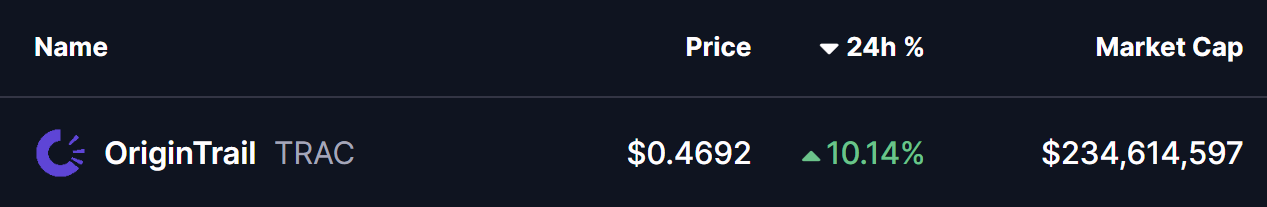
Source: Coinmarketcap
Fractal Breakout Hints at Potential Upside Move
On the daily chart, TRAC has confirmed a breakout from an ascending triangle pattern near the $0.46 level. This breakout is particularly important as price is now trading just above the 200-day moving average, a level that has historically acted as a major trend-defining zone for TRAC.
What makes this setup more compelling is its similarity to previous breakout phases. In late July 2025, a comparable structure resulted in a 63% upside move after price held above its breakout base. Later, in early October 2025, TRAC broke out from a right-angled descending broadening wedge pattern. That move was followed by a reclaim of the 200-day moving average and ultimately led to a powerful 113% rally.
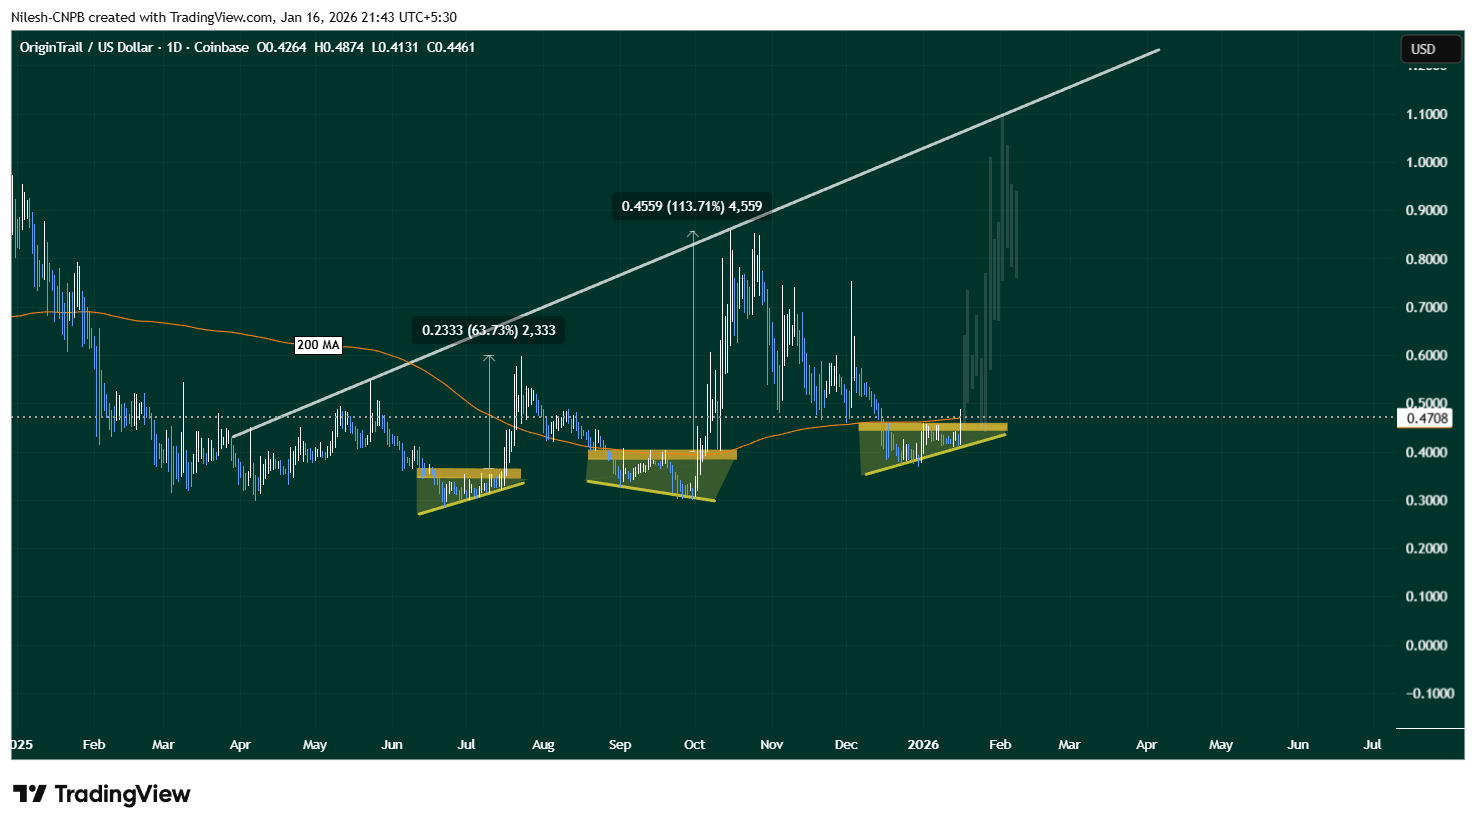
OriginTrail (TRAC) Daily Chart/Coinsprobe (Source: Tradingview)
The current setup shares key characteristics with those earlier moves. Price compression, a clean breakout, and interaction with the 200-day MA suggest that TRAC may once again be transitioning from consolidation into expansion.
What’s Next for TRAC?
If this fractal breakout plays out as expected, holding the $0.44–$0.46 zone as support will be crucial. A sustained hold above this range, along with continued strength above the 200-day moving average, could act as a launchpad for further upside.
In that scenario, TRAC may attempt a move toward its long-term ascending resistance trendline, which currently sits above the $1.00 level. A push toward that zone would align closely with the magnitude of prior fractal-driven rallies seen on the chart.
That said, fractal patterns are never guarantees. Broader market conditions, liquidity, and overall sentiment will continue to influence price action. A failure to hold the $0.44–$0.46 support zone or a rejection back below the 200-day moving average could invalidate the breakout and weaken the bullish fractal thesis.
Bottom Line
TRAC is showing early signs of another technically significant breakout, supported by historical fractal behavior and a reclaim of a key long-term moving average. If buyers can defend the current support zone, the chart suggests that OriginTrail may be positioning itself for a larger upside move in the weeks ahead.
Disclaimer: The views and analysis presented in this article are for informational purposes only and reflect the author’s perspective, not financial advice. Technical patterns and indicators discussed are subject to market volatility and may or may not yield the anticipated results. Investors are advised to exercise caution, conduct independent research, and make decisions aligned with their individual risk tolerance.
About Author: Nilesh Hembade is the Founder and Lead Author of Coinsprobe, with over 5 years of experience in the cryptocurrency and blockchain industry. Since launching Coinsprobe in 2023, he has been providing daily, research-driven insights through in-depth market analysis, on-chain data, and technical research.
Disclaimer: The information on this page may come from third parties and does not represent the views or opinions of Gate. The content displayed on this page is for reference only and does not constitute any financial, investment, or legal advice. Gate does not guarantee the accuracy or completeness of the information and shall not be liable for any losses arising from the use of this information. Virtual asset investments carry high risks and are subject to significant price volatility. You may lose all of your invested principal. Please fully understand the relevant risks and make prudent decisions based on your own financial situation and risk tolerance. For details, please refer to
Disclaimer.
Related Articles
ETF Absorbs Over $1.1 Billion Yet Struggles to Rescue the Market? Powell and Oil Prices Team Up to Put Pressure On, Bitcoin Breaks Key Support
Despite Bitcoin ETF inflows of $1.16 billion, Bitcoin price pulled back to $71,000, declining over 4%. Analysts attribute the pullback to interest rate expectations and inflation pressures, while ETF inflows indicate that institutions view Bitcoin as a long-term asset. The weakness in U.S. equities has also impacted the crypto market.
GateNews29m ago
XRP Today’s News: Goldman Sachs Holds 154 Million XRP in ETF, Institutional Buying Fails to Drive Up the Price
Goldman Sachs has become the largest public holder of XRP spot ETF with a position of approximately $154 million, but this institutional signal has yet to be reflected in the coin price, with XRP still hovering around $1.29. Technical analysis shows that the $1.50 support level is critical, and a breakthrough could push prices higher.
MarketWhisper1h ago
Whale Buys Million in Ethereum! Low-Level Rebound Signals Emerge, Is ETH Price Inflection Point Coming?
Recently, an Ethereum whale returned to the market, purchasing 50,706 ETH with 111 million USDT, demonstrating confidence in the current price. Meanwhile, other large wallets have exhibited similar buying behavior, elevating market attention toward Ethereum. Although Ethereum's price continues to face pressure, institutional capital inflows and improved regulatory environment in the United States provide certain support to the market, potentially establishing mid-term support levels.
GateNews1h ago
Today's cryptocurrency fear and greed index dropped to 23, with the market shifting to an extremely fearful state.
Gate News: On March 19, according to Alternative.me data, today's cryptocurrency Fear and Greed Index dropped to 23, with the market transitioning from yesterday's "panic state" (index 26) to "extreme panic state."
GateNews2h ago
Why Did Bitcoin Decline Today? Powell Sends Hawkish Signals, Trump Considers Troop Increase in Middle East
Bitcoin fell to $70,767 on March 19 following hawkish signals from Federal Reserve Chairman Powell, who warned that rising oil prices could exacerbate inflation; meanwhile, U.S. military troop reinforcements in the Middle East heightened geopolitical risks. The $70,000 level is a critical support for Bitcoin, and a break below it could accelerate further downside.
MarketWhisper2h ago
Here’s Why River (RIVER) Price Is Pumping Today
RIVER's price surged 25% to $27.54, driven by a bullish inverse head-and-shoulders breakout and increased trading volume. Analysts project further gains as traders respond to market conditions and ongoing ecosystem campaigns, indicating strong support for the price.
CaptainAltcoin6h ago
