
Date: 11 Jan 2026, 06:20 PM GMT
Key Highlights
-
Pump.fun (PUMP) posts over 6% intraday gains as broader crypto market sentiment improves.
-
The 4H chart shows a bearish ABCD harmonic pattern, with the bullish CD leg currently in play.
-
Price rebounded strongly from the 100-period moving average, reinforcing trend strength.
-
The pattern projects a potential upside move toward the $0.00296 region.
-
Holding above the $0.00225 support zone remains critical to sustain the bullish structure
The broader cryptocurrency market has regained modest upward momentum today, with both Bitcoin (BTC) and Ethereum (ETH) returning to positive territory. This improvement in sentiment has helped stabilize the altcoin space, and Pump.fun (PUMP) is emerging as one of the stronger performers, posting over a 6% intraday gain.
Beyond the short-term price bounce, PUMP’s chart structure is beginning to show a technically constructive setup that suggests additional upside could be developing.
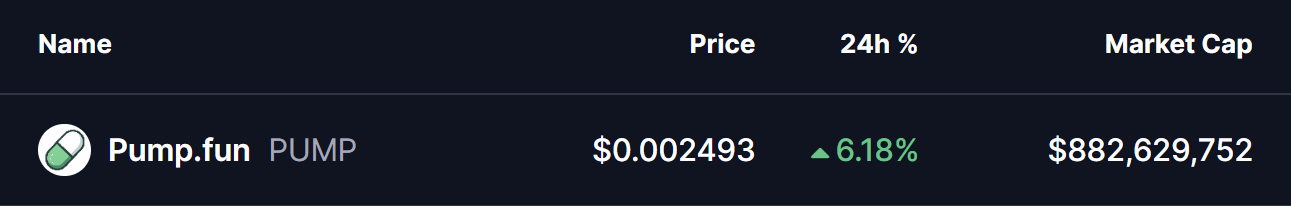
Source: Coinmarketcap
Harmonic Pattern Signals Bullish Continuation
On the 4-hour timeframe, PUMP appears to be forming a bearish ABCD harmonic pattern — a structure that often develops during the later stages of an uptrend. While this pattern can eventually signal a reversal once the final leg completes, the CD leg itself is typically driven by strong bullish momentum, often producing notable upside before any exhaustion sets in.
As illustrated on the chart, the pattern initiated at Point A near $0.00179, followed by a sharp impulsive rally into Point B around $0.00272. Price then entered a corrective phase, pulling back toward Point C near $0.00203.
Importantly, this retracement aligned closely with the 100-period moving average, where buyers stepped in decisively. The swift reaction from this zone reinforced the strength of the underlying trend and helped preserve the harmonic structure.
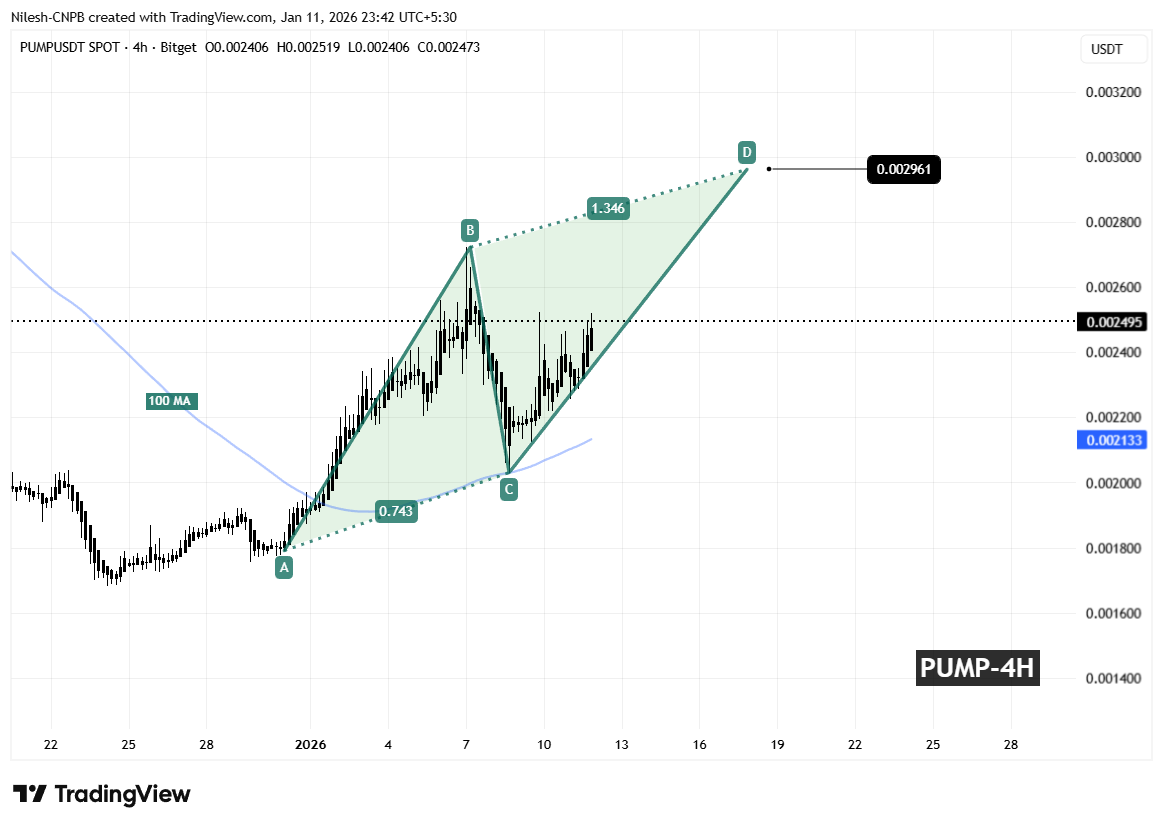
Pump.fun (PUMP) 4H Chart/Coinsprobe (Source: Tradingview)
Since bouncing from Point C, PUMP has resumed its advance and is now trading back around the $0.0025 area, signaling that the CD leg is actively unfolding.
What Could Come Next for PUMP?
If the ABCD pattern continues to play out as projected, the CD leg could extend toward the 1.346 Fibonacci projection of the BC segment. This places the Potential Reversal Zone (PRZ) near $0.00296, which sits roughly 18% above current price levels.
This zone is typically where traders begin to watch for signs of short-term exhaustion or profit-taking, as harmonic patterns often complete around these extensions. Until then, momentum favors the bulls, provided the structure remains intact.
From a risk perspective, holding above the $0.00225 support region will be crucial. A decisive breakdown below this level would weaken the harmonic setup and increase the likelihood of renewed downside pressure.
For now, PUMP’s price action remains technically constructive, with buyers defending key levels and momentum pointing toward a possible continuation higher before any broader consolidation or reversal attempt emerges.
Frequently Asked Questions (FAQ)
What is driving Pump.fun (PUMP) price higher today?
PUMP is benefiting from improving overall market sentiment and a bullish harmonic structure on the 4-hour chart, supported by strong buying interest near the 100-period moving average.
What pattern is forming on the PUMP chart?
The chart indicates a bearish ABCD harmonic pattern. While such patterns can lead to reversals at completion, the CD leg often produces strong bullish momentum before that point.
What is the upside target for Pump.fun (PUMP)?
If the CD leg continues, the projected upside target lies near the $0.00296 level, which aligns with the 1.346 Fibonacci extension.
Is Pump.fun (PUMP) still bullish in the short term?
As long as price remains above key support and momentum holds, the short-term outlook remains cautiously bullish.
Disclaimer: The views and analysis presented in this article are for informational purposes only and reflect the author’s perspective, not financial advice. Technical patterns and indicators discussed are subject to market volatility and may or may not yield the anticipated results. Investors are advised to exercise caution, conduct independent research, and make decisions aligned with their individual risk tolerance.
About Author: Nilesh Hembade is the Founder and Lead Author of Coinsprobe, with over 5 years of experience in the cryptocurrency and blockchain industry. Since launching Coinsprobe in 2023, he has been providing daily, research-driven insights through in-depth market analysis, on-chain data, and technical research.
Disclaimer: The information on this page may come from third parties and does not represent the views or opinions of Gate. The content displayed on this page is for reference only and does not constitute any financial, investment, or legal advice. Gate does not guarantee the accuracy or completeness of the information and shall not be liable for any losses arising from the use of this information. Virtual asset investments carry high risks and are subject to significant price volatility. You may lose all of your invested principal. Please fully understand the relevant risks and make prudent decisions based on your own financial situation and risk tolerance. For details, please refer to
Disclaimer.
Related Articles
The situation in the US-Iran war worsens, oil prices rise by 4%, and the surge in US Treasury yields impacts US stocks, causing them to fall.
Due to the worsening Middle East situation and soaring U.S. Treasury yields, concerns about inflation have intensified, causing the U.S. stock market to retreat and turning the sentiment cautious. Energy stocks rose against the trend, and crude oil prices broke through $100 per barrel, further fueling market panic. U.S. import prices experienced their largest increase since 2022, and postal services raised fuel surcharges, drawing attention to the consumer confidence index. The Federal Reserve chair succession process has stalled amid political disputes, and the cryptocurrency market remains flat as investors stay on the sidelines.
ChainNewsAbmedia42m ago
Crypto edges off of worst levels after Trump extends Iran strike pause
Bitcoin recovered after President Trump's announcement of a 10-day pause on attacks against Iran's energy infrastructure, helping stabilize markets following recent declines. Despite a volatile day, bitcoin is currently trading above $69,000, while other cryptocurrencies also saw some rebound.
CoinDesk1h ago
BTC 15-minute increase of 0.97%: Driven by active buying and ETF fund inflows pushing the market higher
On March 26, 2026, from 20:00 to 20:15 (UTC), the 15-minute spot Bitcoin (BTC) candlestick return was +0.97%, with a price range of 68,428.7 to 69,460.2 USDT and an amplitude of 1.51%. Trading volume during this period increased by 18% compared to the previous period, reaching approximately $120 million. Market attention significantly intensified, and short-term volatility increased.
The main driver of this movement was strong active buying in the spot market. Specifically, multiple large transfers of ≥1000 BTC appeared on-chain, with net inflows of BTC on major trading platforms totaling approximately 28.
GateNews2h ago
Solana Reclaims $90 as Golden Cross Signals Renewed Momentum
Solana has surpassed the $90 resistance, aided by a golden cross indicating positive momentum, despite low trading volume. Strong on-chain growth supports price stability, and sustained support above $89.50 could push Solana towards $96, though higher volume is crucial for confirming a breakout.
CryptoNewsLand3h ago
Bittensor TAO Jumps 17% as Market Momentum Strengthens
Key Insights:
Bittensor surged 17% in one day, with strong weekly and monthly gains supported by broader crypto stability and rising investor participation.
Institutional access expanded through new exchange products while Grayscale’s trust premium signaled sustained demand for
CryptoNewsLand3h ago
Zcash Rally Gains Strength as Privacy Demand and ZODL Funding Lift ZEC
Key Insights:
The Zcash price rose above $235 with strong volumes, reflecting sustained institutional participation and signaling broader market confidence in privacy-focused digital assets.
The $25 million ZODL funding supports protocol upgrades, wallet growth, and shielded adoption,
CryptoNewsLand3h ago
