
Date: Fri, Jan 02, 2026 | 10:54 AM GMT
The broader cryptocurrency market has started the new year with modest strength, as both Bitcoin (BTC) and Ethereum (ETH) trade slightly higher with gains of over 2%. This renewed stability across majors has helped improve overall sentiment, allowing several altcoins to regain momentum — including Aster (ASTER).
ASTER is currently trading around 4% higher on the day, but the more important development lies beneath the surface. On lower timeframes, price action is beginning to highlight a constructive bullish structure, suggesting that the token may be preparing for a meaningful breakout if the setup confirms.
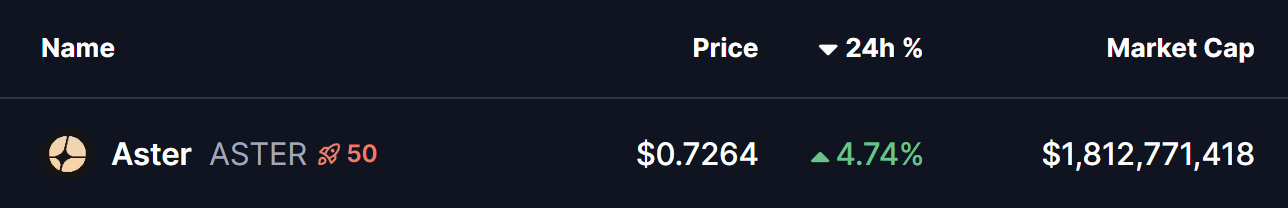
Source: Coinmarketcap
Ascending Triangle Structure Takes Shape
On the 4-hour chart, ASTER is forming a clear ascending triangle, defined by a series of higher lows pressing steadily against a horizontal resistance zone. This type of structure is widely regarded as a bullish continuation pattern, particularly when it develops during consolidation and shows consistent buyer accumulation at rising support levels.
ASTER recently faced rejection near the $0.7367 neckline resistance, which pushed price back toward its ascending support trendline around the $0.68 region. Importantly, each dip has been met with strong buying interest, preventing any deeper pullback and keeping the bullish structure intact. This behavior indicates that sellers are gradually losing control as buyers step in earlier on every retracement.
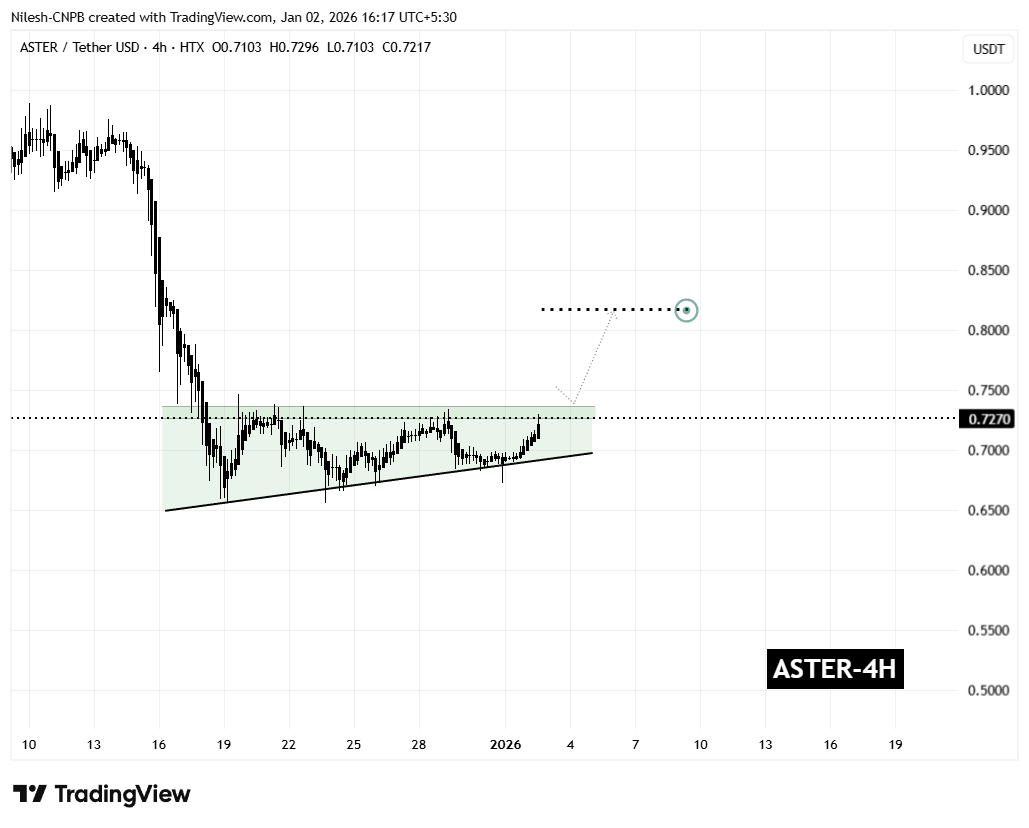
Aster (ASTER) 4H Chart/Coinsprobe (Source: Tradingview)
The latest rebound has once again carried ASTER toward the upper boundary of the triangle, reinforcing the idea that demand remains firm. Rather than signaling weakness, this sideways-to-higher price action reflects healthy consolidation as volatility tightens ahead of a potential breakout.
What’s Next for ASTER?
From here, ASTER appears to be preparing for another test of the $0.7367 resistance zone. A decisive breakout above this level, followed by a sustained close and a successful retest as support, would confirm the ascending triangle pattern and likely trigger a bullish expansion phase.
Based on the measured move of the formation, the technical upside projection points toward the $0.8178 region. This target represents a potential upside of roughly 12% from current levels and also aligns with previous price structure, adding further confidence to the bullish outlook.
That said, caution remains warranted. If ASTER fails to break above resistance, price could once again drift back toward the rising support trendline. As long as this trendline continues to hold, the broader bullish setup remains valid. A decisive breakdown below support, however, would invalidate the pattern and postpone any breakout scenario.
For now, the combination of improving market sentiment, consistent dip-buying, and a tightening ascending triangle structure suggests that Aster is approaching a critical decision point — one that could define its next significant move as 2026 begins.
Disclaimer: The views and analysis presented in this article are for informational purposes only and reflect the author’s perspective, not financial advice. Technical patterns and indicators discussed are subject to market volatility and may or may not yield the anticipated results. Investors are advised to exercise caution, conduct independent research, and make decisions aligned with their individual risk tolerance.
About Author: Nilesh Hembade is the Founder and Lead Author of Coinsprobe, with over 5 years of experience in the cryptocurrency and blockchain industry. Since launching Coinsprobe in 2023, he has been providing daily, research-driven insights through in-depth market analysis, on-chain data, and technical research.
Disclaimer: The information on this page may come from third parties and does not represent the views or opinions of Gate. The content displayed on this page is for reference only and does not constitute any financial, investment, or legal advice. Gate does not guarantee the accuracy or completeness of the information and shall not be liable for any losses arising from the use of this information. Virtual asset investments carry high risks and are subject to significant price volatility. You may lose all of your invested principal. Please fully understand the relevant risks and make prudent decisions based on your own financial situation and risk tolerance. For details, please refer to
Disclaimer.
Related Articles
Bitcoin Breaks Below $71,000, Peter Brandt Warns of Two-Way Movement Risk
On March 19th, Bitcoin's price fell below $71,000, declining approximately 5% within 24 hours. Ethereum, Solana, and Dogecoin all dropped 5% to 6%, with total market capitalization evaporating over $100 billion. Senior traders point out that Bitcoin exhibits both bullish and bearish technical patterns, and macroeconomic factors are affecting market sentiment, with short-term trends remaining uncertain.
GateNews13m ago
Cardano (ADA) trades within a multi-year accumulation zone, with analysts monitoring its potential upside.
Cardano (ADA) is currently trading in the support zone of $0.18 to $0.25, which has historically bounced multiple times. Analysts point out that if this support holds and breaks through the downtrend line, ADA could rally to $1 and $3, representing gains of 270% and 1,011% respectively. Maintaining support is key to a bullish outlook.
GateNews14m ago
Bitcoin Briefly Falls Below $70,000 Mark During Asian Session as Fed Hawkishness and Macro Uncertainty Weigh on Market Volatility
Bitcoin fell below 70,000 on March 19, touching approximately 69,537, reflecting market concerns about the Federal Reserve maintaining high interest rates. Bitcoin subsequently rebounded to around 70,180, demonstrating psychological support at the 70,000 level. Despite improved market fund inflows, cryptocurrencies continue to face challenges amid global macroeconomic pressures, with 70,000 becoming a critical near-term level.
区块客22m ago
MICA Daily | Is the Fed Worried About Inflation Getting Out of Control? US Stocks Decline, BTC Tests $71,000 Again
Yesterday, BTC fell from $73,000 to $71,000 due to declining US stocks and deteriorating Middle East conditions, with risk-off sentiment heating up in the market. The Federal Reserve kept interest rates unchanged, with Powell emphasizing that the US employment market and energy crisis make decision-making difficult, indicating uncertain economic prospects ahead that could impact both stock and crypto markets.
区块客27m ago
The Federal Reserve maintains interest rates, Bitcoin is pressured near $70,000, and the Iran conflict escalation increases market uncertainty.
The Federal Reserve kept its benchmark interest rate unchanged on March 19, with a voting result of 11 to 1. Chairman Powell pointed out that the situation in the Middle East and rising oil prices introduce uncertainties to the economy, and short-term inflation expectations have been raised to 2.7%. The market response was notable, with risk assets performing poorly. Analysts advise paying attention to future interest rate movements.
GateNews34m ago
Solana Price Clears Key Resistance, Eyes $100 Level
Solana (SOL) has broken through a significant sell pressure zone after a month of consolidation, indicating a potential bullish breakout toward the $100 mark.
GateNews35m ago
