
**Date: **Tue, Jan 06, 2026 | 10:08 AM GMT
The broader cryptocurrency market continues to show fresh strength at the start of the new year. Both Bitcoin (BTC) and Ethereum (ETH) are posting weekly gains of over 6%, helping restore confidence across the market. This improving sentiment is now spilling over into major altcoins — including Jupiter (JUP).
JUP has already delivered an impressive 20% gain on the week. While the short-term momentum is encouraging, the more important development is unfolding on the higher-timeframe chart. Recent price action suggests a meaningful shift in market behavior, hinting that JUP could be transitioning from a corrective phase into a broader bullish continuation if key resistance zones are reclaimed.
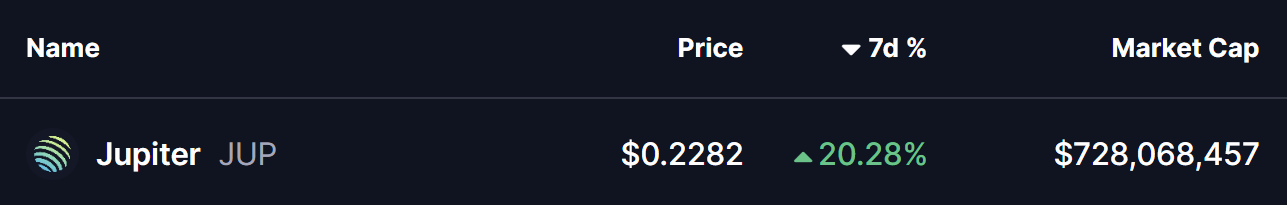
Source: Coinmarketcap
Rounding Bottom Formation Taking Shape
On the daily chart, Jupiter appears to be forming a rounding bottom pattern — a classic bullish reversal structure that typically develops after extended downside pressure and gradual seller exhaustion.
This setup began after JUP faced a strong rejection from the $0.4540–$0.4760 resistance zone in late October. That rejection triggered a sharp sell-off, dragging price lower toward the $0.17 region. However, bears failed to maintain control beyond that point. Selling pressure faded, demand began to absorb supply, and price started stabilizing.
Over time, volatility compressed and JUP began curling higher in a smooth, rounded fashion — closely matching the textbook behavior of a developing rounding bottom. Importantly, the recent recovery has pushed price back above the 50-day moving average around $0.2192, a level that previously capped upside attempts and now appears to be turning into support.
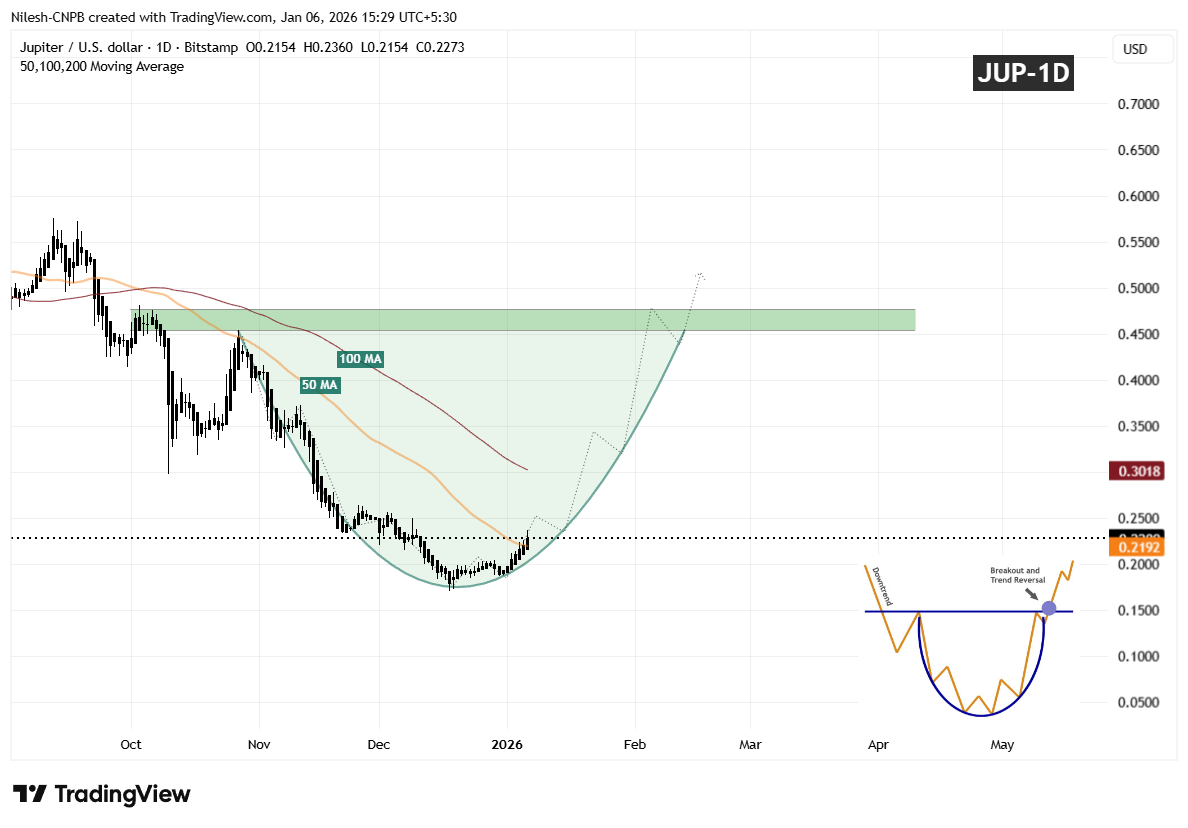
Jupiter (JUP) Daily Chart/Coinsprobe (Source: Tradingview)
The gradual slope of the recovery suggests organic accumulation rather than speculative spikes, reinforcing the credibility of the developing base.
What’s Next for JUP?
If JUP continues to hold above the 50-day moving average, this level could serve as a solid foundation for further upside, with the 100-day moving average acting as the next upside magnet in the near term.
A clean and decisive breakout above the $0.4540–$0.4760 resistance zone, followed by sustained acceptance above that area, would confirm the rounding bottom reversal and likely open the door for a broader bullish expansion phase.
Until that breakout occurs, the pattern remains in development. Some short-term consolidation or shallow pullbacks are possible as price digests recent gains. However, as long as JUP continues to print higher lows above the established base, the broader structure remains constructive.
For now, the chart suggests Jupiter is approaching a critical confirmation phase — one that could determine whether this recovery matures into a sustained bullish trend as 2026 progresses.
Disclaimer: The views and analysis presented in this article are for informational purposes only and reflect the author’s perspective, not financial advice. Technical patterns and indicators discussed are subject to market volatility and may or may not yield the anticipated results. Investors are advised to exercise caution, conduct independent research, and make decisions aligned with their individual risk tolerance.
About Author: Nilesh Hembade is the Founder and Lead Author of Coinsprobe, with over 5 years of experience in the cryptocurrency and blockchain industry. Since launching Coinsprobe in 2023, he has been providing daily, research-driven insights through in-depth market analysis, on-chain data, and technical research.
Disclaimer: The information on this page may come from third parties and does not represent the views or opinions of Gate. The content displayed on this page is for reference only and does not constitute any financial, investment, or legal advice. Gate does not guarantee the accuracy or completeness of the information and shall not be liable for any losses arising from the use of this information. Virtual asset investments carry high risks and are subject to significant price volatility. You may lose all of your invested principal. Please fully understand the relevant risks and make prudent decisions based on your own financial situation and risk tolerance. For details, please refer to
Disclaimer.
Related Articles
ZANO Roars Back, Records 11.2% As Bullish Rectangle Structure Prints Continuing Market Rally: Ana...
Zano (ZANO) coin is experiencing a surge in price and trading volume, reaching $7.25. Analysts note a bullish rectangle pattern indicating sustained upward momentum, reflecting increased demand for privacy-focused cryptocurrencies amid broader market recovery.
BlockChainReporter31m ago
BTC rises 0.74% in 15 minutes: FOMC meeting digestion and short covering drive short-term volatility
Between 2026-03-19 15:45 to 16:00 (UTC), BTC experienced a 15-minute price range of 68787.0 to 69550.9 USDT, achieving a realized return rate of +0.74% with an amplitude of 1.11%. During the same period, market attention increased, short-term volatility intensified, and fund behavior and sentiment indicators both showed concentrated changes.
The primary driver of this price movement was the conclusion of the FOMC meeting, after which the market saw no new bearish catalysts. Some short sellers chose to cover their positions, providing upward momentum to the price in the short term. Additionally, while ETF fund outflows reflected institutional profit-taking, they did not form a sustained trading
GateNews33m ago
Aster (ASTER) Price Rejected Again at $0.80 – Is a Sharp Drop Next?
Aster (ASTER) is once again facing trouble at the $0.80 level, and the repeated rejection is starting to raise concerns. What once looked like a potential breakout is now turning into a clear area of resistance that the price simply can’t overcome.
This level has held firm since December,
CaptainAltcoin35m ago
Bitcoin Price Discovery Mechanism Shifts to Derivatives-Driven Model, 2024 ETF Approval Becomes Key Turning Point
Bitcoin's price mechanism is shifting from spot-driven dynamics to derivative ecosystem influences, with the introduction of financial instruments like futures and options significantly shaping price discovery. Investors are adopting more sophisticated strategies, incorporating Bitcoin into macro asset allocation frameworks, reflecting the market structure's increasing impact on price formation.
GateNews1h ago
Bitcoin Slips Below $70,000 as Fed Rate Pause and Oil Surge Pressure Markets
Bitcoin declined to $70,000 due to steady interest rates from the Federal Reserve and rising energy prices, leading to $600 million in liquidations and increased market volatility, particularly affecting altcoins.
CryptoBreaking1h ago
XRP Climbs 3% Past $1.47 as Breakout Extends on Bitcoin-Led Rally
Key Takeaways
XRP broke above $1.426 resistance after months of consolidation, jumping to $1.47 on surging volume
Trading volume spiked over 250% during the move, indicating strong participation in the breakout
Activity on the XRP Ledger continues climbing, with tokenized real-world assets
CryptoBreaking1h ago
