
**Date: **Wed, Jan 07, 2026 | 06:20 AM GMT
The broader cryptocurrency market continues to show strong New Year momentum, with Bitcoin (BTC) up around 4% and Ethereum (ETH) gaining over 9% on a weekly basis. This improving sentiment is gradually spilling over into major altcoins — including the DePIN-focused token Akash Network (AKT).
AKT has already posted an impressive 20% weekly gain. While this short-term strength has caught traders’ attention, the more important development is unfolding on the higher-timeframe chart. Recent price action suggests a meaningful shift in market structure, hinting that AKT may be transitioning out of a prolonged corrective phase and into the early stages of a bullish continuation.
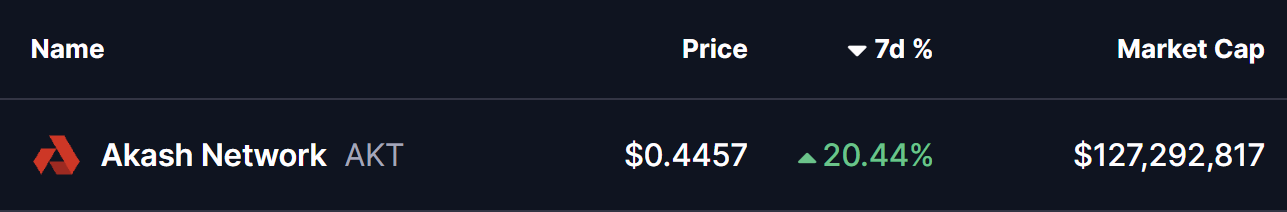
Source: Coinmarketcap
Falling Wedge and Rounding Bottom in Play
On the daily chart, AKT has been trading within a broader falling wedge — a structure that often precedes bullish reversals as selling pressure gradually weakens. Within this larger wedge, price action is also shaping a developing rounding bottom pattern, reflecting steady accumulation and seller exhaustion.
The formation began after AKT faced strong rejection near the $0.5441 resistance zone in late November. That rejection triggered a sharp sell-off, pushing price lower toward the $0.3465 region. However, bears failed to extend losses beyond this area. Instead, demand stepped in, downside momentum slowed, and price began to stabilize.
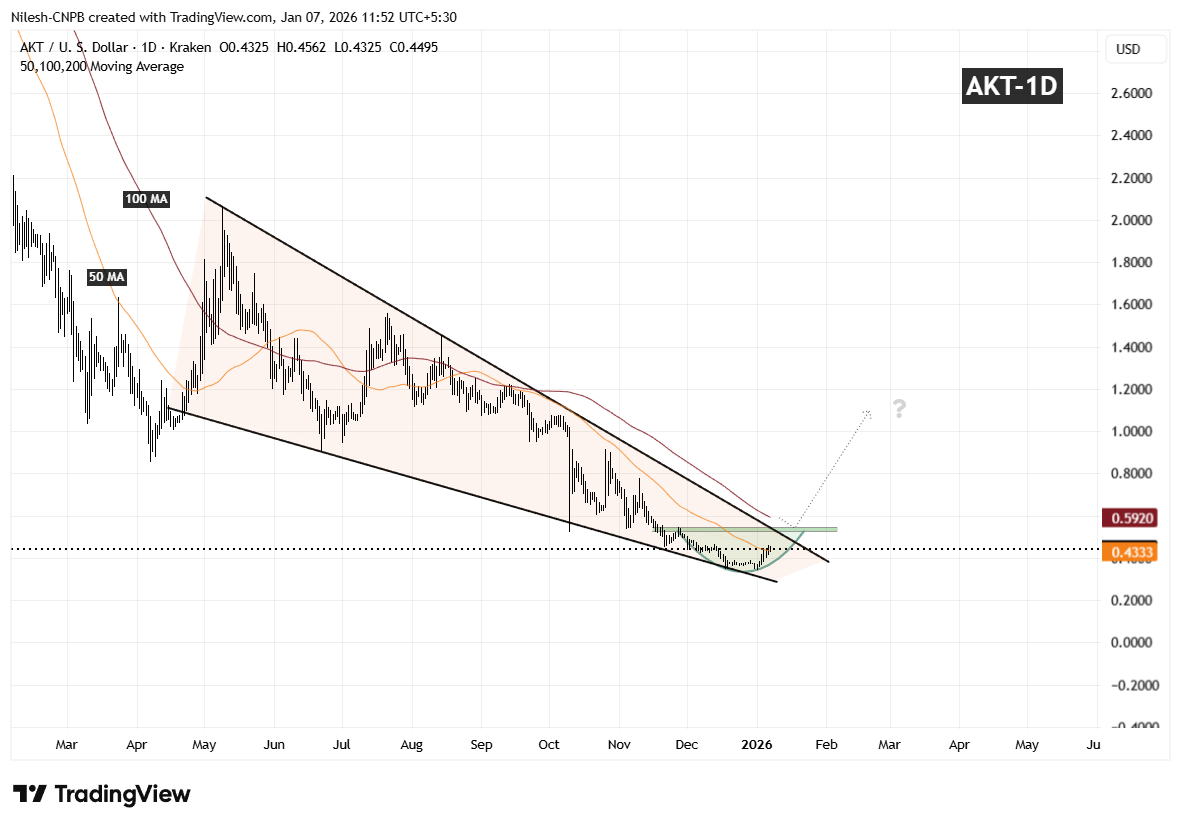
Akash Network (AKT) Daily Chart/Coinsprobe (Source: Tradingview)
Over the following weeks, volatility compressed and AKT started to curl higher in a smooth, rounded fashion — closely matching the textbook behavior of a rounding bottom. Importantly, the recent rebound has pushed price back above the 50-day moving average around $0.4333, a level that had previously acted as resistance and is now beginning to flip into support.
What’s Next for AKT?
If AKT can continue to hold above the 50-day moving average, this area may act as a solid base for further upside attempts. From here, attention shifts toward the descending resistance trendline of the falling wedge, which aligns closely with the $0.5441 resistance zone.
A clean and decisive breakout above this confluence area, followed by sustained acceptance, would confirm a broader bullish expansion phase and mark a clear trend reversal from the prior downtrend. Such a move would likely attract renewed momentum participation as the market recognizes the structural shift.
Until that breakout occurs, the pattern remains in development. Short-term consolidation or shallow pullbacks are still possible as price digests recent gains. However, as long as AKT continues to print higher lows above the established base, the broader technical structure remains constructive.
Overall, the chart suggests AKT is approaching a critical inflection point — one that could determine whether this recovery evolves into a sustained bullish trend as 2026 progresses.
Disclaimer: The views and analysis presented in this article are for informational purposes only and reflect the author’s perspective, not financial advice. Technical patterns and indicators discussed are subject to market volatility and may or may not yield the anticipated results. Investors are advised to exercise caution, conduct independent research, and make decisions aligned with their individual risk tolerance.
About Author: Nilesh Hembade is the Founder and Lead Author of Coinsprobe, with over 5 years of experience in the cryptocurrency and blockchain industry. Since launching Coinsprobe in 2023, he has been providing daily, research-driven insights through in-depth market analysis, on-chain data, and technical research.
Disclaimer: The information on this page may come from third parties and does not represent the views or opinions of Gate. The content displayed on this page is for reference only and does not constitute any financial, investment, or legal advice. Gate does not guarantee the accuracy or completeness of the information and shall not be liable for any losses arising from the use of this information. Virtual asset investments carry high risks and are subject to significant price volatility. You may lose all of your invested principal. Please fully understand the relevant risks and make prudent decisions based on your own financial situation and risk tolerance. For details, please refer to
Disclaimer.
Related Articles
US Treasury Yields Rise, Iran Tensions Persist, Inflation Risks Press Bitcoin Prices
Bitcoin tests the $67,500 support level again, gold prices pull back significantly, and markets reduce risk assets due to concerns about Iran conflict and inflation impacts. U.S. Treasury yields rise, indicating investors shifting to cash amid economic uncertainty.
金色财经_20m ago
Bitunix Analyst: Energy Suppression and War Uncertainty Mismatch, BTC Maintains Liquidity Range Structure
Market activity is influenced by policy, with energy price volatility and Middle East risks coexisting, leading capital flows toward safe-haven assets. BTC exhibits liquidity-driven oscillatory movements, lacking conditions for trend continuation in the short term. We need to await a one-way breakout in either energy or liquidity.
BlockBeatNews24m ago
Altcoins' Appeal Fades! BlackRock: AI Compute-Native Currency Thesis Will Drive Next Bull Market
BlackRock's Head of Digital Assets, Robbie Mitchnick, stated that the cryptocurrency market is consolidating around a few mainstream tokens, mainly because many altcoins lack long-term value. He believes that the symbiotic relationship between AI and cryptocurrencies will drive future bull markets, especially as Bitcoin miners shift toward AI businesses, highlighting the potential synergy between the two.
MarketWhisper28m ago
TAO Up 94.9% Over the Past Month, Bittensor Completes Largest Decentralized LLM Pretraining in History
TAO price continues to rise, reaching new highs at $337.84, with a 24-hour gain of 13.6%. Well-known investor Jason Calacanis expressed bullish sentiment on TAO and invested in its ecosystem projects. Bittensor subnets completed important pre-training, demonstrating their practical application capabilities.
GateNews50m ago
Why Did Bitcoin Rise Today? Trump Plans One-Month Ceasefire, Risk Assets Rally in Sync
The U.S. has presented a 15-point ceasefire proposal to Iran through Pakistan, triggering significant reactions across global financial markets. Oil prices have plummeted, gold has surged, U.S. stock index futures have strengthened, and Bitcoin has rebounded. Amid the volatility, if Bitcoin holds the $68,230 support level, it could rally back to $76,000 by month-end. Market reactions still carry uncertainty and require further confirmation on execution details.
MarketWhisper1h ago
Citigroup Slashes Bitcoin and Ethereum 12-Month Price Targets, Citing Stalled U.S. Crypto Legislation Weighing on Upside Catalysts
Citigroup has lowered its 12-month price targets for Bitcoin and Ethereum, signaling a shift toward caution on the cryptocurrency market's medium-term outlook, primarily due to slow progress in U.S. crypto asset legislation. Bitcoin's target was reduced from $143,000 to $112,000, while Ethereum's fell to $3,175. Despite upside potential remaining in the future, the lack of new policy catalysts suggests prices may oscillate within a range in the near term. Citigroup's assessment of Ethereum is more cautious, as it believes the asset is more significantly impacted by on-chain activity.
区块客1h ago
