
PENGU has slowly worked its way back onto trader radars, and when you look at the chart, it is easy to see why. After weeks of grinding higher, the PENGU price is now back inside its previous quarterly value area. That is usually where things get interesting, because it often decides whether a move continues or stalls.
TimelessBeing summed it up well by pointing out that PENGU has been one of the stronger performers lately. The chart backs that up, even if it also hints that some short-term chop is still on the table before anything more aggressive happens.
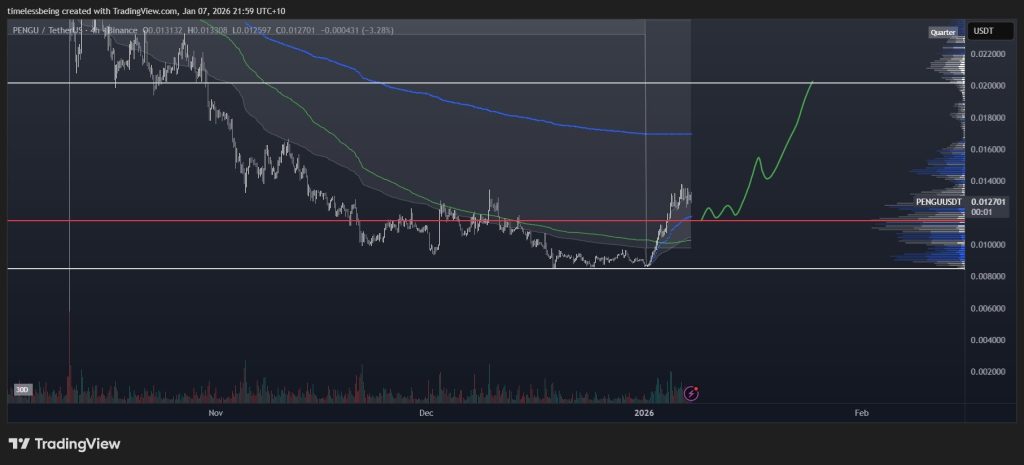
Source: X/@Timeless_Crypto
- The PENGU Downtrend Finally Loses Control
- Why This Area Matters So Much
- What’s Next for PENGU?
The PENGU Downtrend Finally Loses Control
For most of Q4, the PENGU price was stuck in a clean downtrend. Each bounce was sold into, with moving averages acting like ceilings and the price continuing to print lower highs. Then, around the $0.009–$0.010 zone, that selling pressure eased and fresh lows stopped appearing.
It instead started to drift sideways, thus forming a base instead of sliding further. Volume also cooled off during this period, which is often a good sign. It usually means weaker hands are gone and the market is taking a breather rather than panicking.
The recent push higher marked the first real shift in structure. Price broke above the short-term trend lines and moved back into a zone where buyers had previously shown interest.
ChatGPT Predicts Bittensor (TAO) Price at the End of January_**
Why This Area Matters So Much
Right now, PENGU is trading around the $0.0125 to $0.0127 level, which lines up with previous value and visible trading activity. This is the level the market needs to respect. Holding above it keeps the setup looking healthy. Losing it would likely mean more sideways action rather than an immediate breakdown.
The PENGU price is also sitting above the shorter-term moving averages, while the longer-term one still sits higher up, closer to the $0.017 to $0.018 area. That usually leads to some messy price action as the market decides whether it has the strength to push higher.
What’s Next for PENGU?
If the PENGU price continues to hold above this reclaimed value area, the path toward $0.02 stays open. That level lines up with previous resistance and the projected move shown on the chart.
The idea is simple. Consolidate above support, shake out impatient traders, and then grind higher once selling pressure fades. A clean break and hold above the mid-range would likely speed things up.
For now, nothing looks overheated. Structure has improved, value has been reclaimed, and downside pressure has clearly eased. PENGU does not need to surge higher immediately, but compared to a few weeks ago, the chart looks far more constructive.
Disclaimer: The information on this page may come from third parties and does not represent the views or opinions of Gate. The content displayed on this page is for reference only and does not constitute any financial, investment, or legal advice. Gate does not guarantee the accuracy or completeness of the information and shall not be liable for any losses arising from the use of this information. Virtual asset investments carry high risks and are subject to significant price volatility. You may lose all of your invested principal. Please fully understand the relevant risks and make prudent decisions based on your own financial situation and risk tolerance. For details, please refer to
Disclaimer.
Related Articles
Ethereum Approaches Cycle Low as Bitmain Indicates Violent Belief
The article explores Ethereum's potential market bottom, highlighting its correlation with past S&P 500 trends and significant institutional investment by Bitmain. Despite mixed market sentiment, historical patterns suggest possible recovery.
CryptoBreaking25m ago
Analyst: If Bitcoin falls below the $66,000 support level, it may trigger a 10%-20% correction
Gate News reported that on March 20, Chartered Market Technician (CMT) Aksel Kibar stated on March 21 that the lower support boundary of Bitcoin's potential rising wedge formation is located at 66,000, and a breakdown below this level could trigger a bearish reversal. Aksel Kibar pointed out that rising wedges, as a classic technical pattern, typically appear at the end of uptrends, signaling price momentum exhaustion. Historical data shows that after similar downside breakdowns are confirmed, the average pullback ranges from 10%-20%.
GateNews2h ago
Bitcoin Slips Below $70,000 as Fed Rate Pause and Oil Surge Pressure Markets
Bitcoin declined to $70,000 due to steady interest rates from the Federal Reserve and rising energy prices, leading to $600 million in liquidations and increased market volatility, particularly affecting altcoins.
CryptoBreaking2h ago
XRP Climbs 3% Past $1.47 as Breakout Extends on Bitcoin-Led Rally
Key Takeaways
XRP broke above $1.426 resistance after months of consolidation, jumping to $1.47 on surging volume
Trading volume spiked over 250% during the move, indicating strong participation in the breakout
Activity on the XRP Ledger continues climbing, with tokenized real-world assets
CryptoBreaking2h ago
BTC down 0.65% in 15 minutes: Large spot selling orders dominate short-term pullback, panic sentiment intensifies volatility amplification
2026-03-20 13:45 to 2026-03-20 14:00 (UTC), BTC declined 0.65% within 15 minutes, with price range fluctuating between 69795.3 to 70399.4 USDT, reaching an amplitude of 0.86%. Market volatility intensified in the short term, trading activity increased, and investor attention rose.
The main driver of this price movement was concentrated large-scale active selling in the spot market. During this period, major trading platforms saw multiple large sell orders exceeding 100 BTC each, with sell orders accounting for 52% of volume, directly driving prices downward.
GateNews4h ago
