
Date: Wed, Dec 31, 2025 | 11:36 AM GMT
As the final day of 2025 arrives, the broader cryptocurrency market is showing modest strength. Both Bitcoin (BTC) and Ethereum (ETH) are trading slightly in the green, helping stabilize overall sentiment. This steady backdrop has created room for select altcoins — including Pump.fun (PUMP) — to begin forming constructive technical structures after prolonged downside pressure.
PUMP is starting to stand out, posting a nearly 5% daily gain and trimming its 60-day decline to around 57%. While the recovery is still early, the more important development is visible on the daily chart, where price action is beginning to hint at a meaningful structural shift. If confirmed, this setup could mark the early stages of a broader bullish continuation.
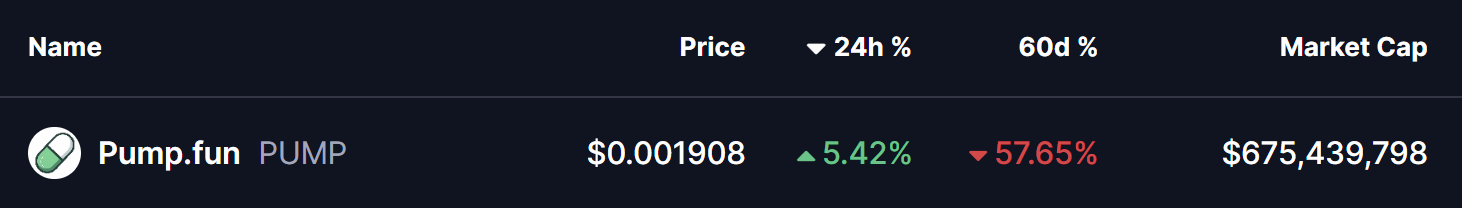
Source: Coinmarketcap
Rounding Bottom in Play
On the daily timeframe, PUMP appears to be carving out a classic rounding bottom formation — a well-known bullish reversal pattern that typically develops after an extended downtrend. This pattern reflects a slow but steady transition from aggressive selling to quiet accumulation, as sellers gradually lose control and buyers begin stepping in with more confidence.
Earlier in the trend, PUMP faced strong rejection near the $0.03396 neckline region, which triggered a sharp and extended decline. That sell-off eventually found a floor near the $0.0017 level, a zone that has since acted as a critical demand area. Multiple defenses of this region prevented further downside and laid the foundation for a potential trend reversal.
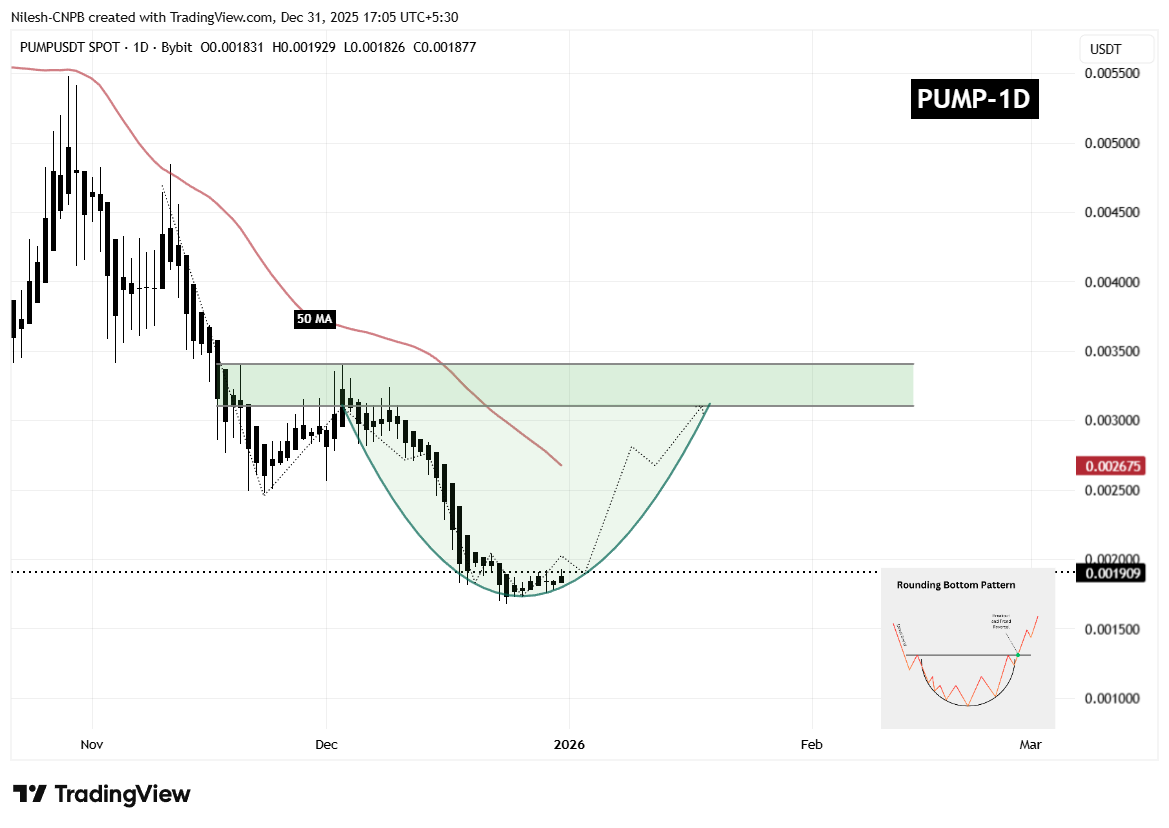
$PUMP Daily Chart/Coinsprobe (Source: Tradingview)
Since establishing this base, PUMP has started to curve higher in a rounded fashion on the chart. This gradual upward arc suggests that selling pressure is fading rather than ending abruptly — a key characteristic of healthier bottoming structures. The recent recovery above the $0.0019 region further supports the idea that accumulation is underway and that market participants are positioning ahead of a larger move.
What’s Next for PUMP?
For the rounding bottom structure to gain confirmation, PUMP needs to reclaim the 50-day moving average, currently hovering near the $0.002675 mark. A sustained move above this level would signal a shift in short-term momentum and reinforce the view that buyers are beginning to regain control after months of corrective price action.
Looking further ahead, the most significant technical barrier remains the neckline resistance around $0.03396. A clean and decisive breakout above this zone would validate the entire reversal pattern and could usher in a broader bullish expansion phase. Such a move would likely attract renewed interest from momentum traders who have remained sidelined during the prolonged downtrend.
Until those levels are reclaimed, the pattern remains in its development phase. Short-term consolidation or minor pullbacks cannot be ruled out, especially if price hesitates near the 50-day moving average. However, as long as PUMP continues to form higher lows and holds above the $0.0017 base, the broader rounding bottom structure remains intact.
Overall, PUMP is approaching a technically significant inflection point. The evolving rounding bottom pattern, improving price structure, and proximity to key resistance levels suggest that the coming sessions could be decisive in determining the token’s next major directional move as the market steps into 2026.
Disclaimer: The views and analysis presented in this article are for informational purposes only and reflect the author’s perspective, not financial advice. Technical patterns and indicators discussed are subject to market volatility and may or may not yield the anticipated results. Investors are advised to exercise caution, conduct independent research, and make decisions aligned with their individual risk tolerance.
About Author: Nilesh Hembade is the Founder and Lead Author of Coinsprobe, with over 5 years of experience in the cryptocurrency and blockchain industry. Since launching Coinsprobe in 2023, he has been providing daily, research-driven insights through in-depth market analysis, on-chain data, and technical research.
Disclaimer: The information on this page may come from third parties and does not represent the views or opinions of Gate. The content displayed on this page is for reference only and does not constitute any financial, investment, or legal advice. Gate does not guarantee the accuracy or completeness of the information and shall not be liable for any losses arising from the use of this information. Virtual asset investments carry high risks and are subject to significant price volatility. You may lose all of your invested principal. Please fully understand the relevant risks and make prudent decisions based on your own financial situation and risk tolerance. For details, please refer to
Disclaimer.
Related Articles
Santiment: The surge in active USDT addresses on a certain public blockchain is correlated with the rebound of BTC
Research firm Santiment found that over the past year, when USDT active addresses on a certain public blockchain surged three times, BTC price rebounded each time, indicating that USDT liquidity has a significant impact on BTC price.
GateNews29m ago
PEPE Consolidates Above $0.05324 Support as Momentum Strengthens and Resistance Near $0.05336 Holds
PEPE has a tight intraday price compression with a support level of $0.053243 and resistance level of $0.053363.
A RSI of 64.13 represents the moderate bullish momentum whereas MACD history is slightly positive, which indicates the gradual buying momentum.
The price is at $0.053364
CryptoNewsLand32m ago
Michael Saylor: Strategy - There is a time lag between buying Bitcoin and price appreciation
Gate News reports that on March 12, Strategy founder Michael Saylor posted: "There is a time lag between when we purchase Bitcoin and when the Bitcoin price skyrockets."
GateNews1h ago
Why OXT Just Skyrocketed 21.97% in 30 Minutes
OXT price surged 21.97%, now at $0.0211, driven by macroeconomic trends and increased trading activity. Analysts suggest the bullish sentiment in major cryptocurrencies boosts altcoin interest, while traders watch key resistance and support levels.
Coinfomania1h ago
BTC Rises 0.79% in 15 Minutes: On-Chain Large Capital Inflows and Favorable Macro Policies Drive Market Upswing
2026-03-12 15:15 to 2026-03-12 15:30 (UTC), BTC recorded a +k-line return of 0.79%, with price fluctuating between 69702.5 and 70428.9 USDT, reaching an amplitude of 1.04%. Trading activity was robust during this time window, with noticeably elevated market attention and intensified short-term volatility.
The primary driver of this price movement was on-chain large fund flows and increased institutional participation. During the same period, multiple large transfers exceeding 1,000 BTC flowed into exchange cold wallets, with whale addresses concentrating their buying activities. [Text appears to be incomplete]
GateNews1h ago
ETH 15-minute surge 0.94%: On-chain capital inflows and technical upgrade expectations resonate to drive gains
2026-03-12 15:15 to 2026-03-12 15:30 (UTC), ETH fluctuated within 1.15%, with price rising from 2047.22 USDT to 2070.72 USDT, achieving +0.94% gains. During the same period, market attention increased, trading volume expanded significantly, volatility enhanced compared to daily levels, and on-chain activity and capital flow data expanded synchronously, indicating concentrated efforts from bullish forces.
The main driving forces behind this price movement stem from concentrated on-chain capital inflows and technical upgrade expectations resonance. On-chain data shows that during the anomaly period ETH activity
GateNews1h ago