
Date: Mon, Dec 22, 2025 | 06:56 AM GMT
The broader altcoin market has experienced choppy and largely directionless price action over the past several weeks, a phase that began after the sharp sell-off on October 10. That correction dragged Ethereum (ETH) down from the sub-$4,700 region to the $3,000 area, leaving traders cautious and overall risk appetite muted. Over the last 60 days alone, ETH has declined by nearly 21%, reinforcing a short-term bearish narrative across the altcoin space.
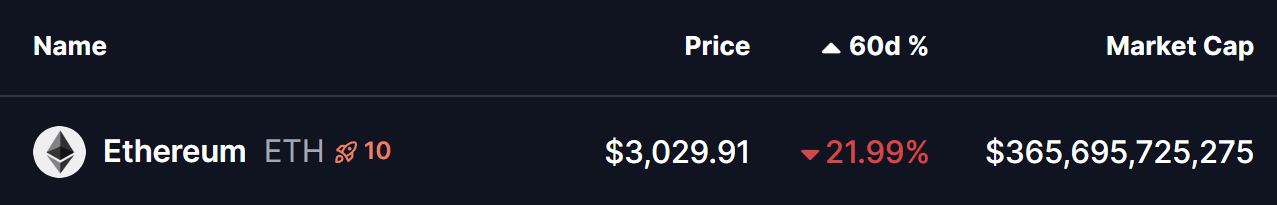
Source: Coinmarketcap
However, beneath the surface, the higher-timeframe technical structure is starting to hint at something far more constructive. Long-term signals on the ETH/BTC chart are now aligning in a way that has historically preceded major altcoin expansions, raising the possibility that the current weakness could be laying the groundwork for a bullish reversal into 2026.
ETH/BTC Chart Hints at a Bullish Altcoin Expansion
According to the latest analysis shared by @el_crypto_prof, the ETH/BTC weekly chart has once again recreated a structure that closely mirrors previous cycle transitions. This setup focuses on the interaction between the SMA100 and EMA100, two moving averages that have historically defined the beginning and end of major altcoin cycles.
In past market cycles, altcoin bull markets have tended to begin when the SMA100 crosses below the EMA100 — a bearish crossover that, counterintuitively, has marked long-term bottoms rather than tops. These moments often coincided with peak pessimism, underperformance of ETH versus BTC, and broad disinterest in altcoins.
Conversely, altcoin bull markets have historically ended when the SMA100 crosses back above the EMA100, signaling overheating conditions and the return of Bitcoin dominance.
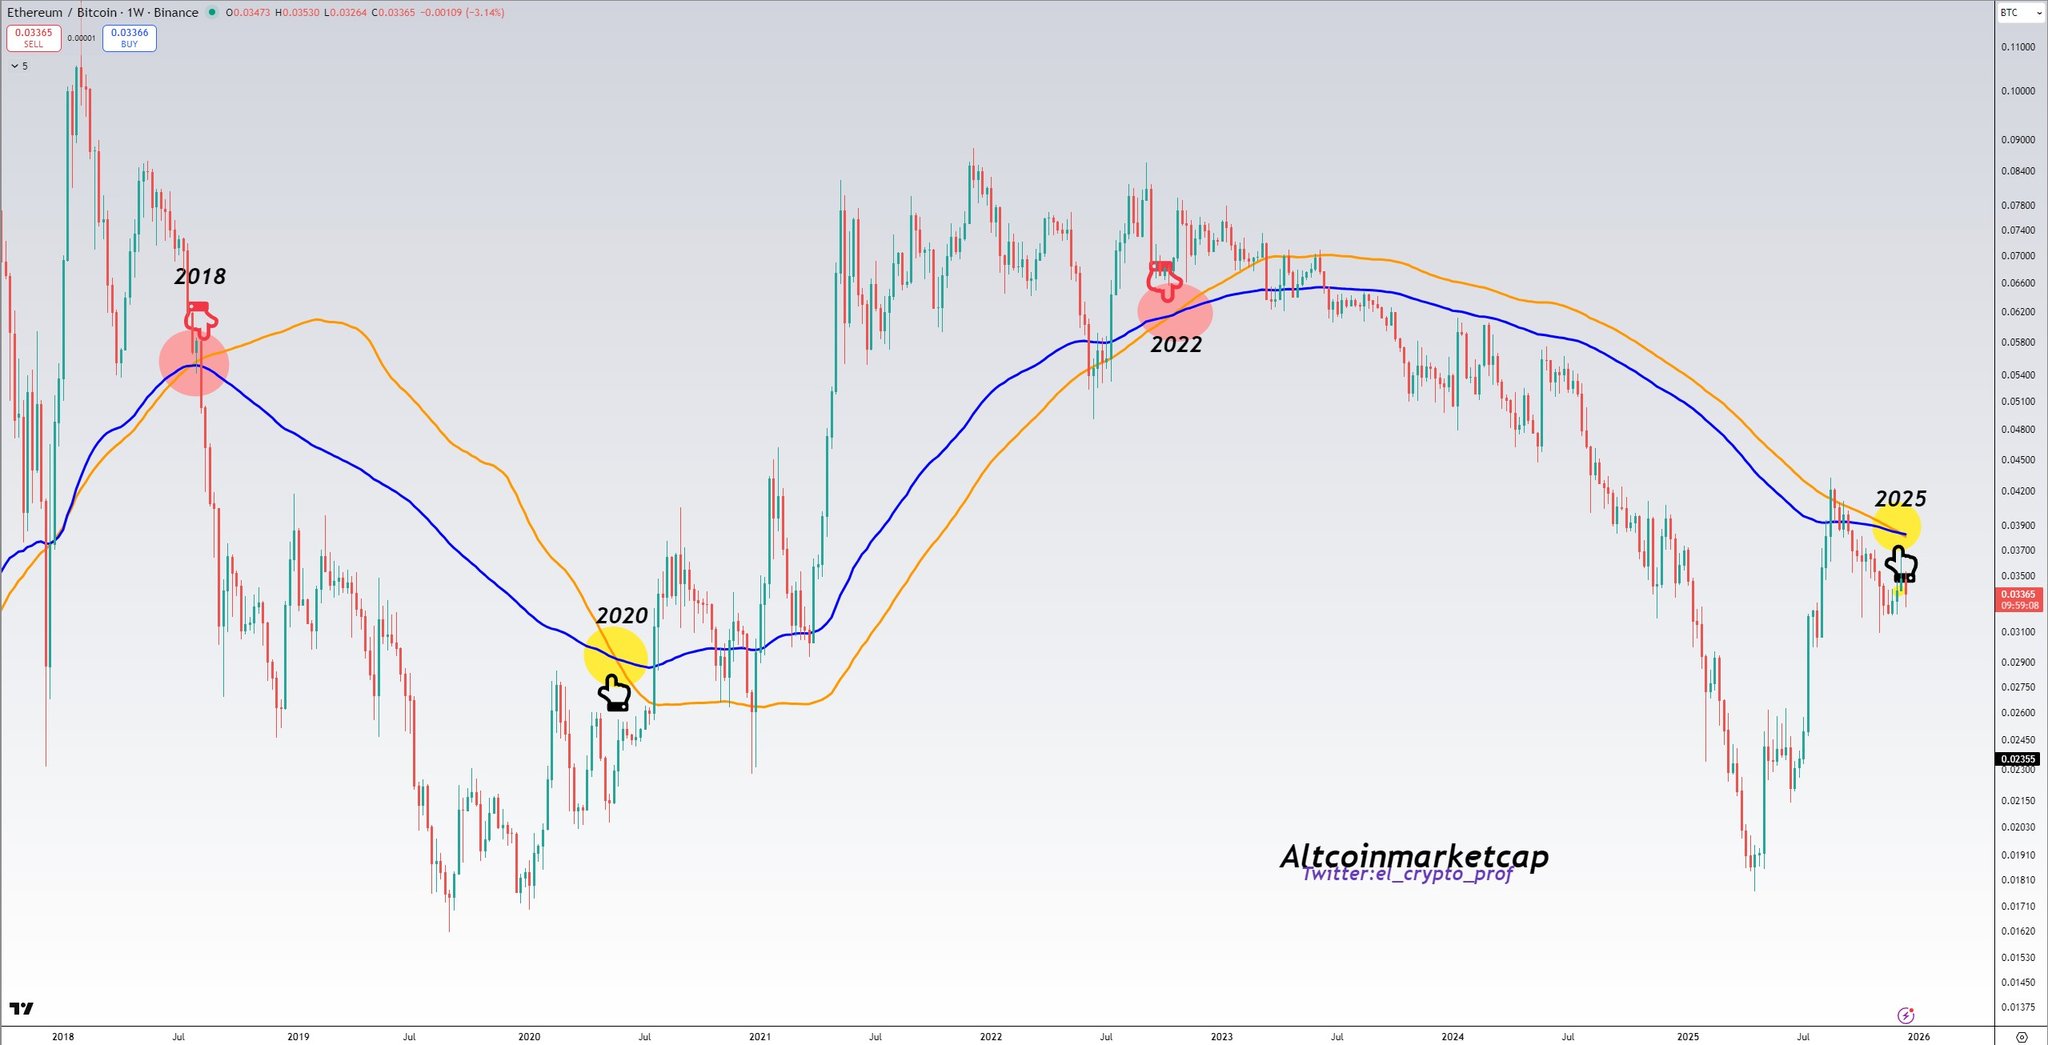
ETH-BTC Pair Chart/Credits: @el_crypto_prof (X)
The chart highlights three key moments:
In 2018, the bullish crossover marked the end of the altcoin cycle and preceded prolonged underperformance.
In 2020, the bearish crossover aligned closely with the start of a powerful altcoin expansion that carried into 2021.
In 2022, the bullish crossover once again signaled exhaustion and the onset of another prolonged correction.
Now, in 2025, the ETH/BTC pair has once again printed a bearish SMA100–EMA100 crossover, placing the market at a familiar inflection point. Historically, this has been the zone where altcoins quietly transition from distribution to accumulation.
What’s Next for Altcoins?
If this long-term setup continues to play out as it has in previous cycles, the coming months could mark the early stages of a broader altcoin recovery rather than the continuation of a downtrend. While short-term volatility and further downside cannot be ruled out, the structural signal suggests that downside risk may be gradually diminishing.
For altcoins, this phase has typically been characterized by range-bound price action, selective accumulation, and patience — followed by a sharp expansion once momentum returns and capital begins rotating out of Bitcoin.
Importantly, this is not a timing signal for immediate upside. Long-term moving average crossovers operate on a macro scale and often precede major rallies by months. But they do provide context: historically, these moments have offered some of the best risk-reward conditions for long-term altcoin exposure.
As 2026 approaches, the ETH/BTC chart suggests the altcoin market may be closer to a structural reset than many currently expect. If history repeats, today’s consolidation could ultimately be remembered as the calm before the next major altcoin cycle.
Disclaimer: The views and analysis presented in this article are for informational purposes only and reflect the author’s perspective, not financial advice. Technical patterns and indicators discussed are subject to market volatility and may or may not yield the anticipated results. Investors are advised to exercise caution, conduct independent research, and make decisions aligned with their individual risk tolerance.
Disclaimer: The information on this page may come from third parties and does not represent the views or opinions of Gate. The content displayed on this page is for reference only and does not constitute any financial, investment, or legal advice. Gate does not guarantee the accuracy or completeness of the information and shall not be liable for any losses arising from the use of this information. Virtual asset investments carry high risks and are subject to significant price volatility. You may lose all of your invested principal. Please fully understand the relevant risks and make prudent decisions based on your own financial situation and risk tolerance. For details, please refer to
Disclaimer.
Related Articles
Michael Saylor: The next phase of Bitcoin is digital credit
MicroStrategy founder Michael Saylor proposes the concept of digital credit as a development direction for the cryptocurrency market. Using STRC preferred stock as an example, he emphasizes its low volatility and high yield characteristics. In Saylor's three-layer digital capital framework, digital credit aims to provide stable returns and bridge the gap in institutional crypto allocations, although it also faces critics' concerns about its sustainability.
MarketWhisper8m ago
JPMorgan: Bitcoin absorbs Iran war hedge funds, gold ETF experiences significant outflows
JPMorgan report indicates that due to the Iran conflict, Bitcoin outperformed gold and silver, the latter of which experienced significant declines due to rising interest rates and a strong dollar. Gold's high-position holdings were forcibly liquidated under market pressure, leading to capital outflows. Bitcoin remained stable, demonstrating its appeal as a safe-haven asset, especially amid geopolitical tensions. The report also emphasizes that Bitcoin's market liquidity has surpassed gold, indicating an improvement in its structural position.
MarketWhisper38m ago
Why did Bitcoin drop today? Trump extends Iran ceasefire period by 10 days, negotiations face disagreements.
U.S. President Trump extends the ceasefire period with Iran until April 6, but Iranian officials deny the request, leading to continued market pessimism about the prospects of negotiations. As the U.S. 10-year Treasury yield rises to 4.42%, the attractiveness of high-risk assets like Bitcoin diminishes, preventing a rebound and instead continuing to face selling pressure. The market is sensitive to liquidity conditions, and in the short term, attention should be paid to the direction of yields and spot demand.
MarketWhisper43m ago
Today, the cryptocurrency Fear & Greed Index rose to 13, indicating extreme fear in the market.
Gate News reports that on March 27, data from Alternative.me shows that today’s cryptocurrency Fear and Greed Index has risen to 13, indicating the market is in a state of "extreme fear." Yesterday, the index was 10, also in the "extreme fear" zone.
GateNews1h ago
23.91% Plunge for KMD: What It Means for Traders
KMD has seen a significant decline, trading at $0.005324 after dropping 54.20% in 24 hours. Increased market activity and liquidation events in the derivatives market are contributing to the volatility, prompting traders to focus on risk management.
Coinfomania1h ago
MemeCore Price Volatility Explodes After Hardfork and Perp Listing Surge - BTC Hunts
The post MemeCore Price Volatility Explodes After Hardfork and Perp Listing Surge appeared first on Coinpedia Fintech News
MemeCore price just pulled off one of those blink-and-you-miss-it moves. A brutal 65% intraday surge sent the token flying from $1.70 to $2.80 only to slam straight into a
BTCHUNTS1h ago
