Decred (DCR) is maintaining an impressive breakout momentum, increasing by an additional 5% at the time of writing on Monday, marking its fifth consecutive rally. This upward trend occurs amid bullish efforts to challenge a key resistance zone in the market.
Notably, the limited circulating supply—stemming from continuous user staking and persistent treasury accumulation—is creating significant upward pressure on DCR’s price. From a technical perspective, Decred is at a critical juncture, as increasing buying pressure could determine the next direction of the trend.
Limited Supply Drives DCR Demand
On-chain data shows that 10.9 million DCR are currently staked, accounting for 67.4% of the total mined supply (16.2 million DCR) and locked for 142 days. Additionally, the treasury holds over 873,000 DCR, removing another 5.4% from the circulating supply and reducing actual market liquidity to approximately 4.40 million DCR. This scarcity of supply is significantly boosting demand, attracting increasing investor interest in this privacy-focused coin.
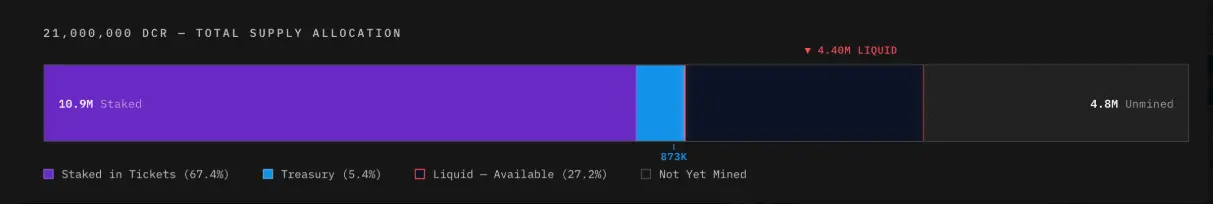 DCR Supply Distribution | Source: Decred.supply## Technical Outlook: Will Decred Continue Its Uptrend?
Decred has gained about 5% at the time of writing on Monday, breaking above the $25.00 level. The short-term recovery is currently challenging the 38.2% Fibonacci retracement at $26.13, calculated from the November 4 high of $70 down to the December 23 low of $14.21. This is a key resistance zone that has repeatedly halted upward attempts since late November, reflecting ongoing significant selling pressure.
If the price can convincingly close above the $26.13 level, the bullish trend may be reinforced, opening the door toward higher Fibonacci retracement levels at $31.54 (50%) and $38.07 (61.8%).
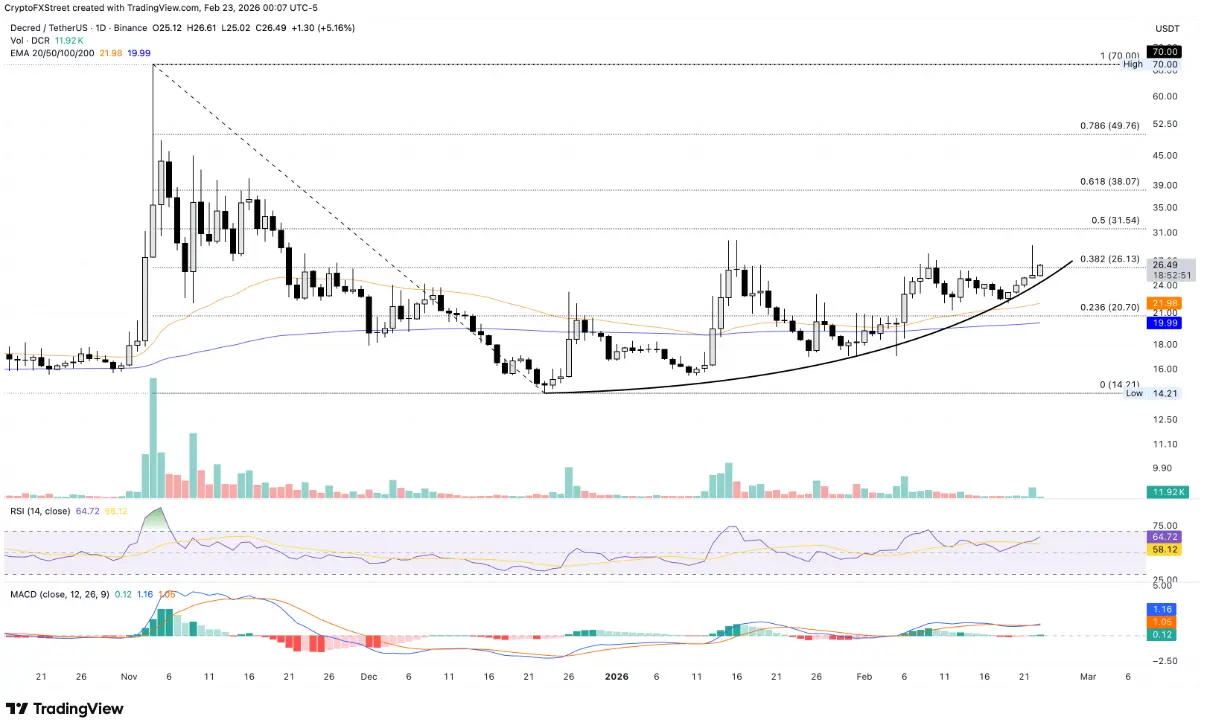 Daily DCR/USDT Chart (Logarithmic) | Source: TradingView In terms of momentum, the Relative Strength Index (RSI) on the daily timeframe is around 63 and continues to rise, indicating increasing buying strength and a sustained recovery from the neutral zone. More importantly, the RSI still has room to grow before entering overbought territory, supporting the scenario of continued price advancement. Additionally, the MACD line has crossed above the signal line, signaling positive momentum and the potential formation of a new bullish impulse.
Conversely, if the price fails to break above and reverses from the $26.13 zone, a correction scenario could unfold, with Decred retreating to test the 50-day Exponential Moving Average (EMA) around $21.96.
Disclaimer: The information on this page may come from third parties and does not represent the views or opinions of Gate. The content displayed on this page is for reference only and does not constitute any financial, investment, or legal advice. Gate does not guarantee the accuracy or completeness of the information and shall not be liable for any losses arising from the use of this information. Virtual asset investments carry high risks and are subject to significant price volatility. You may lose all of your invested principal. Please fully understand the relevant risks and make prudent decisions based on your own financial situation and risk tolerance. For details, please refer to
Disclaimer.
Related Articles
Today the Fear and Greed Index rose to 28, with the market turning into a "panic state"
Gate News, March 17th, according to Alternative.me data, today's Cryptocurrency Fear and Greed Index rose to 28 (23 yesterday), with the market shifting from "extreme fear" to "fear" status.
GateNews19m ago
Bitcoin challenges 75K, Nvidia GTC drives AI token rally
Amid oil price declines, stock markets rebounded, and cryptocurrency market sentiment recovered to neutral levels. Bitcoin touched $74,899, challenging the 75K level. Nvidia's GTC conference drove significant gains in AI-related tokens, with the overall market showing positive momentum.
ChainNewsAbmedia1h ago
ETH Short-term Decline of 0.72%: Sell-side Dominance and Fund Outflow Intensify Risk-off Sentiment
2026-03-16 22:15至22:30(UTC),ETH价格在2355.0至2377.16 USDT区间快速下行,15分钟内收益率为-0.72%,振幅达0.93%。这一波动引发市场关注,交易量与链上活跃度均显著提升,短线波动加剧,情绪趋于谨慎。
本次异动的主要驱动力是急速上涨的卖出交易量与资金流出。ETH主网交易量较此前一小时均值大幅提升18.4%,买卖订单结构发生转变,卖出订单占比跃升至
GateNews2h ago
Michael Saylor Warns Quantum Threat Would Break the Internet - U.Today
Michael Saylor argues that quantum computing poses a universal risk beyond Bitcoin, threatening critical global infrastructure. In response to Chamath Palihapitiya's views on AI and market disruptions, Saylor insists that a transition to Post-Quantum Cryptography will protect Bitcoin and other systems together, emphasizing its resilience as "Digital Capital."
UToday3h ago
Analyst Says Bitcoin Indicators Show Early Signs of Market Recovery
Stablecoin liquidity rose by ~$8B since February, signaling potential improved market trading conditions.
Inter-exchange Flow Pulse turned positive, indicating more Bitcoin moving to derivatives platforms.
Long-term holders retain ~79% of supply, showing gradual supply transfers
CryptoFrontNews4h ago
Bitcoin Surges Above $74K After Rally From $60K Support Level
Bitcoin surged from $60K to nearly $74K, gaining 23% as buyers maintained momentum, indicated by a positive RSI and MACD. Key resistance lies at $74K, with support levels at $72.8K, $71.5K, and $70K. Traders anticipate potential further gains.
CryptoFrontNews4h ago
