Injective (INJ) is cooling off today, down about 6%, but the bigger picture still shows strength. Over the past week, INJ is up roughly 11%, it is trading near $3.58. This move did not come out of nowhere. Several things lined up at once.
Injective just rolled out a major chain upgrade that introduces dynamic gas fees using $INJ. The team says this change improves on-chain revenue while lowering costs for users.
Around the same time, traders noticed that roughly $2 million worth of INJ was bought by larger players. That type of buying often attracts more attention. This coming from lesser-known analyst.
There is also talk of possible buybacks and growing hype around the upcoming Injective Summit 2026 in Washington, D.C. With more announcements expected this year, sentiment around the project has picked up.
However, the INJ price spike is not happening on weak volume. Trading activity jumped more than 50% in a single day, which supports the strength of the move.
INJ is now trading above its short-term moving averages, such as the 7-day SMA and EMA, which is a sign that short-term momentum is changing.
The RSI is at 73, which means that the token is close to being overbought. This does not mean that the bull run is over, but it does mean that the price may cool off before making another move upwards.
What stands out is that the broader market has been flat. Bitcoin barely moved, and total market cap has been almost unchanged. Yet INJ broke higher on its own, showing that capital is flowing into this coin specifically.
_****Silver Triggers Rare 6-Sigma Signal as Analyst Sounds Global Alarm**
What the Injective Chart Is Showing
On the 4H chart, the INJ price had been in a steady downtrend for weeks, making lower highs and drifting toward the $2.65 area. That zone acted as a base, and price has now bounced strongly from there.
The recent breakout pushed INJ back above the $3.50 level, which had acted as resistance. OBV has started ticking higher, which shows stronger buying pressure compared to earlier weeks.
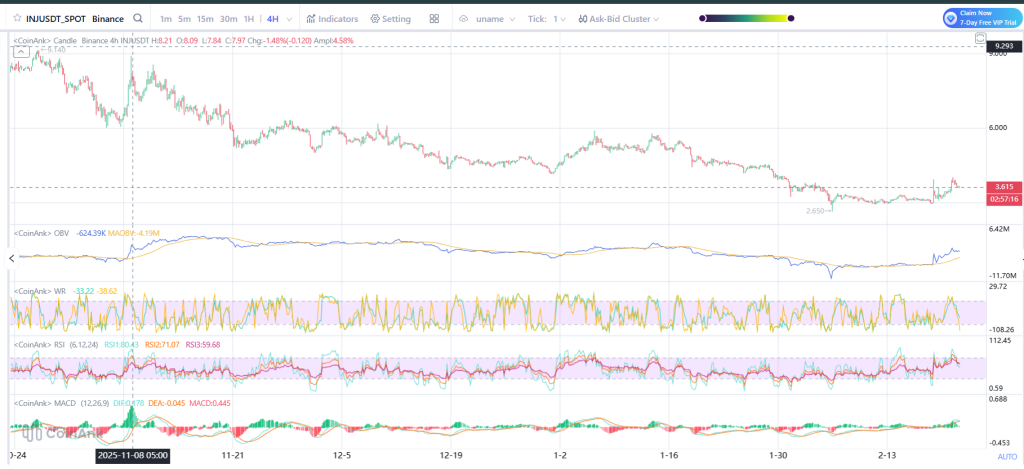
Source: Coinank
The MACD has flipped green, which shows short-term momentum is picking up. The RSI is high, meaning the move is strong, but it may be stretched for now.
_****XRP Price Just Flashed a Historic Capitulation Signal**
What Comes Next for INJ?
If INJ stays above $3.50, the next prices in sight are $4.00 and $4.40. If buyers keep pushing, $5.00 becomes a realistic target.
If the Injective price slips, $3.30 is the first area where it could try to hold. Below that, $3.00 is the line that matters. Losing $3.00 would damage the recent breakout.
Right now, INJ is moving with strength. The upgrade news, large purchases, and higher trading volume have changed the tone on the chart. The next few days around $3.50 will show whether this run continues or cools off.
Disclaimer: The information on this page may come from third parties and does not represent the views or opinions of Gate. The content displayed on this page is for reference only and does not constitute any financial, investment, or legal advice. Gate does not guarantee the accuracy or completeness of the information and shall not be liable for any losses arising from the use of this information. Virtual asset investments carry high risks and are subject to significant price volatility. You may lose all of your invested principal. Please fully understand the relevant risks and make prudent decisions based on your own financial situation and risk tolerance. For details, please refer to
Disclaimer.
Related Articles
Crypto Market Sees Continuous Downturn As Geopolitical Tensions Grow
The global crypto market is down 1.60% to $2.38T amidst escalating U.S.-Iran tensions, with Bitcoin and Ethereum experiencing declines. Notably, some smaller cryptocurrencies have surged. DeFi and NFT sectors show mixed trends, while regulatory developments emerge.
BlockChainReporter42m ago
Where Could Kaspa (KAS) Price Go This Week?
Kaspa (KAS) is showing serious resilience even as its price remains near lows. Kaspa’s hash rate is holding near all-time highs, showing miners aren’t stepping back and the network’s backbone is rock solid.
A major hardfork is coming on May 5, bringing native tokens and more programmability.
CaptainAltcoin1h ago
19.81% Surge for DUSK: What It Means for Traders
DUSK's price surged 19.81% to $0.09667 amid increased market activity and a broader altcoin shift. Analysts highlight its rising relevance and key resistance at $0.10, suggesting significant future trading interest.
Coinfomania1h ago
Bitcoin Briefly Falls Below $70,000 Mark During Asian Session as Fed Hawkishness and Macro Uncertainty Weigh on Market Volatility
Bitcoin dipped below $70,000 on March 19th, touching a low of approximately $69,537, reflecting the market's reassessment of the Federal Reserve's interest rate decision and inflation outlook. Although it later rebounded to around $70,180, the $70,000 level remains a key support in the near term. With weakening market sentiment, coupled with energy prices and macro risks, capital is turning more conservative, and Bitcoin may consolidate around the $70,000 level going forward.
区块客2h ago
XRP Enjoying 'Strong Retail Demand,' Report Says - U.Today
The essay explores the contrasting dynamics between retail and institutional demand in the cryptocurrency market. It highlights XRP's strong retail base and growing adoption, while institutional interest remains cautious, especially compared to assets like Bitcoin and Ethereum, amid recent ETF flows.
UToday2h ago
Fractal model predicts Bitcoin will hit bottom in October 2026
Bitcoin shows positive recovery signals, improving market sentiment after a long phase of volatility. However, experts believe the current uptrend is short-term, with deeper correction risks ahead. According to Crypto Rover's fractal model, Bitcoin's price follows a four-year cycle influenced by halving events. The current cycle likely peaked in late 2025, with further declines expected before a potential bottom around 2026. Short-term price fluctuations can mislead investors, emphasizing the importance of understanding these cycles for long-term trends.
TapChiBitcoin2h ago
