
Key Takeaways
-
Ondo (ONDO) has recorded an all-time high TVL of $2.52 billion, rising over 31% in the past 30 days, signaling strong on-chain growth.
-
Active addresses, holders, and stablecoin market cap have all surged sharply, despite ONDO’s recent price correction.
-
The daily chart shows a right-angled descending broadening wedge, a structure that often appears near potential trend reversals.
The real-world asset (RWA) token Ondo (ONDO) has faced notable pressure in recent weeks, sliding nearly 13% over the past month amid the broader crypto market correction. However, while price action has remained under stress, on-chain data and chart structure tell a very different story — one that hints at growing accumulation and a potential bullish rebound forming beneath the surface.
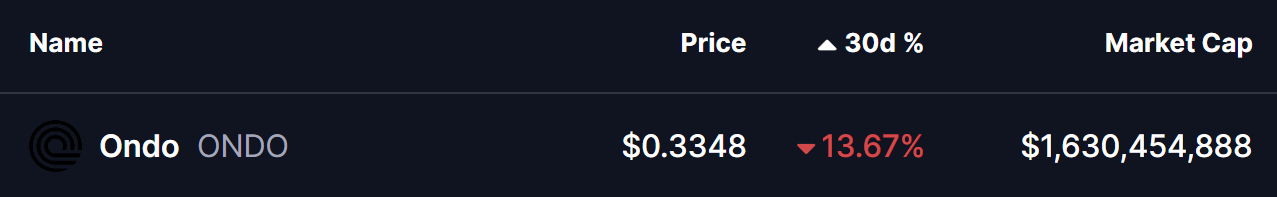
Source: Coinmarketcap
On-Chain Activity Surges Despite Price Weakness
According to the latest data from RWA.xyz, Ondo’s fundamentals continue to strengthen at an impressive pace. The protocol has now recorded an all-time high total value locked (TVL) of $2.52 billion, marking a 31.15% increase in just the past 30 days — a strong signal of rising institutional and on-chain demand.
Other key on-chain metrics are also trending higher:
-
Stablecoin market cap: $74.28 million, up 118% month-over-month
-
Total holders: 67,745, up 34.8% in 30 days
-
Monthly active addresses: 83,519, surging more than 210%
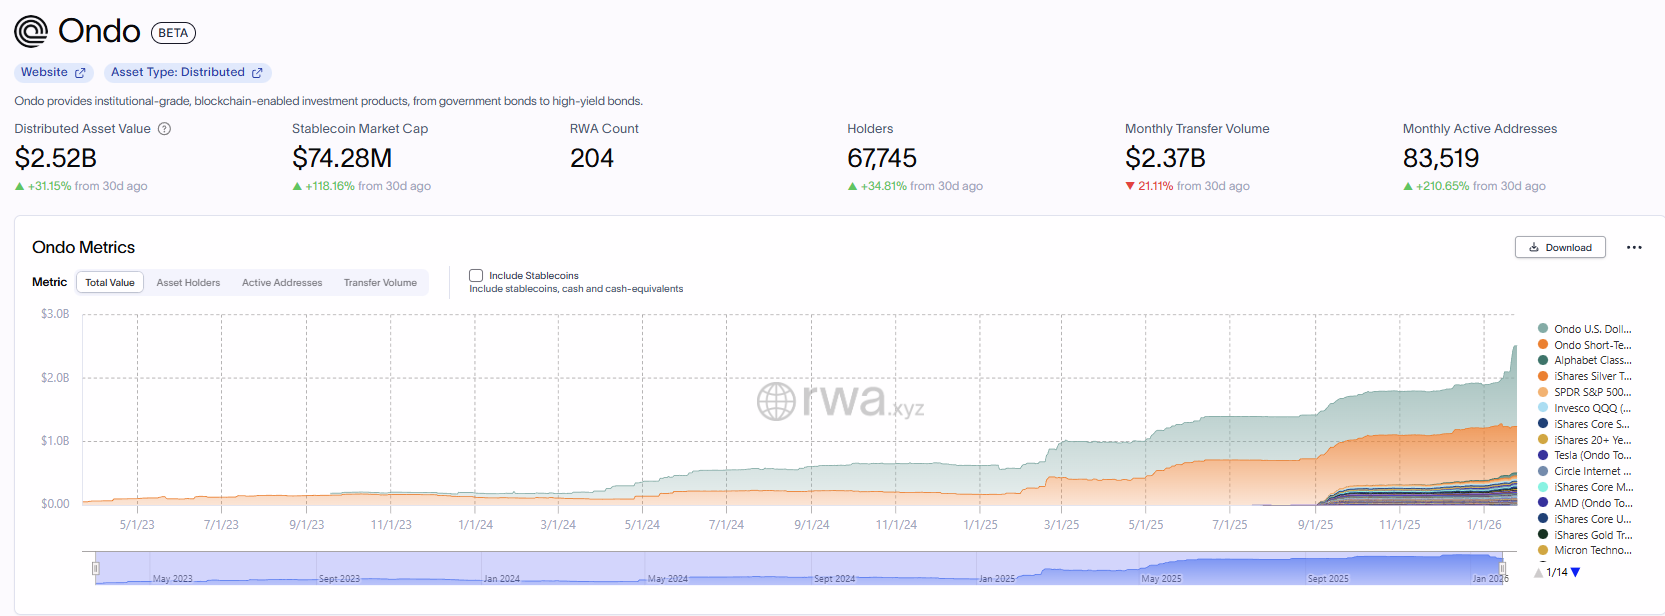
Source: rwa.xyz
This sharp rise in participation and capital flow suggests that users and institutions are increasingly engaging with Ondo’s RWA ecosystem, even as the token’s price consolidates near cycle lows.
Is a Bullish Rebound Taking Shape?
From a technical perspective, ONDO’s daily chart is carving out a right-angled descending broadening wedge — a structure commonly seen during prolonged corrections that can precede trend reversals once selling pressure begins to fade.
This pattern has been developing since ONDO’s rejection from the $1.00–$1.17 resistance zone in September 2025. Since then, price has continued to form lower highs, while volatility has expanded, driving ONDO toward the lower boundary of the wedge near $0.32.
Encouragingly, that support zone has now been successfully defended. Buyers have stepped in near the lower trendline, with ONDO currently hovering around $0.335, suggesting that downside momentum may be weakening after weeks of sustained selling.
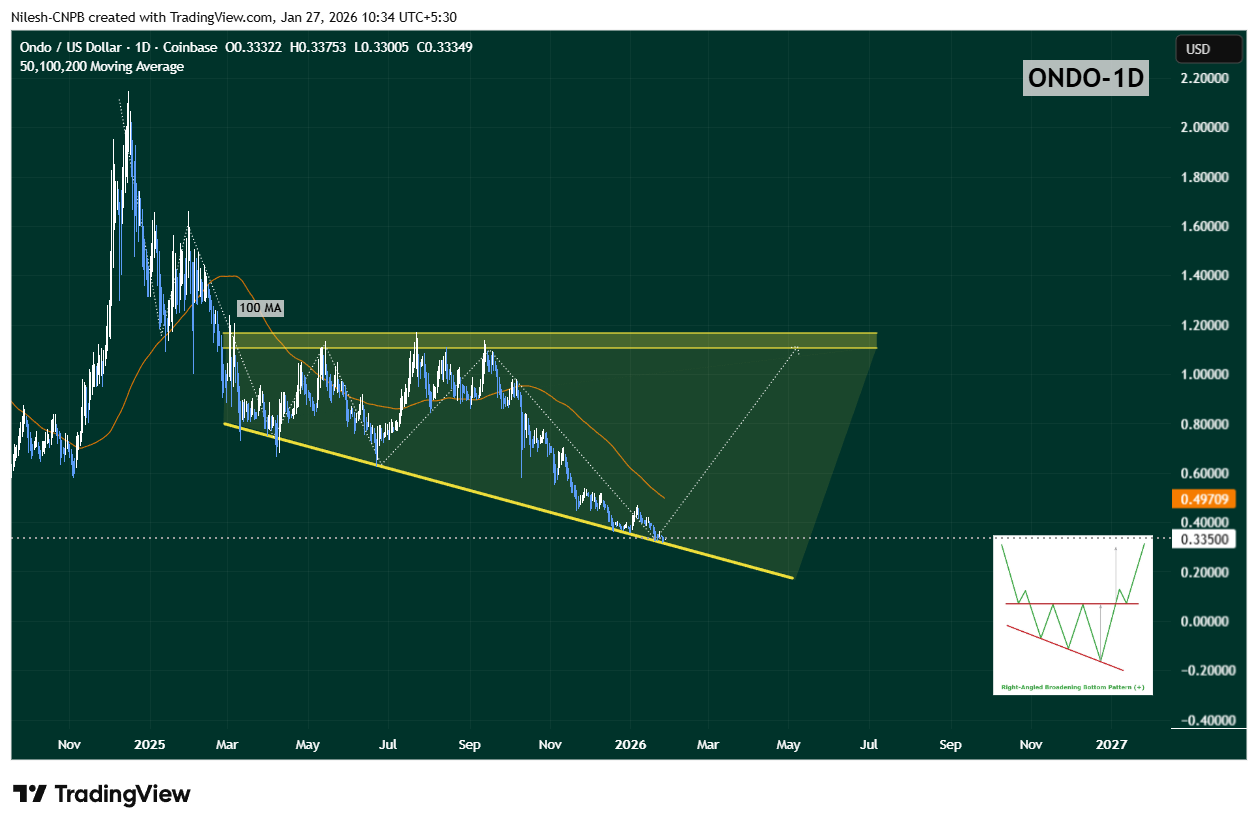
Ondo (ONDO) Daily Chart/Coinsprobe (Source: Tradingview)
Despite early stabilization, upside momentum remains capped for now. The 100-day moving average, sitting near $0.4970, has flipped into strong overhead resistance. Every prior relief rally has stalled below this level, making it a key hurdle for bulls.
Until ONDO can reclaim this moving average, any upside move should be treated as a relief bounce within consolidation, rather than a confirmed trend reversal.
What’s Next for ONDO?
As long as ONDO continues to hold above the $0.32 support zone, the right-angled descending broadening wedge remains valid. Sustained defense of this level keeps the door open for a recovery attempt, especially if price begins posting higher daily or weekly closes.
A reclaim of the 50-day moving average, followed by a breakout above the 100-day MA, would mark a clear shift in momentum. If that scenario plays out, ONDO could gradually advance toward the upper boundary of the wedge, currently aligning near the $1.10–$1.17 region — a move that would represent a major recovery from current levels.
However, a decisive breakdown below the wedge support would invalidate the bullish setup and likely lead to another phase of downside or extended consolidation.
Bottom Line
While ONDO’s price remains under pressure, the disconnect between price action and on-chain growth is becoming increasingly difficult to ignore. Record-high TVL, surging active addresses, and expanding holder counts suggest strong accumulation is taking place beneath the surface.
Combined with a technically constructive wedge pattern near long-term support, ONDO may be approaching a pivotal inflection point — one where fundamentals and structure align for a potential bullish rebound, provided key support levels continue to hold.
Disclaimer: The views and analysis presented in this article are for informational purposes only and reflect the author’s perspective, not financial advice. Technical patterns and indicators discussed are subject to market volatility and may or may not yield the anticipated results. Investors are advised to exercise caution, conduct independent research, and make decisions aligned with their individual risk tolerance.
About Author: Nilesh Hembade is the Founder and Lead Author of Coinsprobe, with over 5 years of experience in the cryptocurrency and blockchain industry. Since launching Coinsprobe in 2023, he has been providing daily, research-driven insights through in-depth market analysis, on-chain data, and technical research.
Disclaimer: The information on this page may come from third parties and does not represent the views or opinions of Gate. The content displayed on this page is for reference only and does not constitute any financial, investment, or legal advice. Gate does not guarantee the accuracy or completeness of the information and shall not be liable for any losses arising from the use of this information. Virtual asset investments carry high risks and are subject to significant price volatility. You may lose all of your invested principal. Please fully understand the relevant risks and make prudent decisions based on your own financial situation and risk tolerance. For details, please refer to
Disclaimer.
Related Articles
The $93 Floor: Why SOL’s Latest Breakout Could Trigger a Massive Short Squeeze
Solana’s SOL token jumped past a key technical resistance level at about $93, turning what analysts called a “39-day distribution zone” into a structural floor.
The move has brought two price targets into focus, one being an initial level near $103 and a secondary one near $113.
Breakout
CryptoPotato19m ago
Amid increasing global uncertainty, Bitcoin whales have accumulated 61,568 BTC in the past month.
According to Santiment’s data, despite heightened tensions in the Middle East, Bitcoin whales and sharks increased their holdings by 62,000 BTC over the past month, showing that holders are inclined to accumulate rather than sell. At the same time, the number of small wallets has also risen. Analysts believe the mega-whales’ accumulation could signal a potential price breakout, but they also warn that a short-term pullback may occur.
BlockBeatNews29m ago
Each mined coin loses $20,000! Bitcoin miners are fleeing, and the "mining difficulty" has dropped by 7.8%.
The Bitcoin mining industry is facing severe challenges, with mining costs surging to $88,000, while the price of Bitcoin is around $68,000, leading to worsening losses for miners. As geopolitical risks and high oil prices take their toll, hashrate continues to decline, and the industry’s pressure also triggers market instability. Many mining firms have started pivoting to AI and high-performance computing in order to survive.
区块客59m ago
Whales accumulate 61,568 BTC despite the market downturn, Santiment indicates a bullish breakout signal.
Amid conflict in the Middle East and economic uncertainty, the whale group holding 10 to 10,000 bitcoins increased its holdings by 61,568 BTC over the past month, which is 280 times more than retail investors. Despite extreme fear in the market, whale accumulation behavior runs counter to market sentiment; historically, this kind of situation often signals a potential breakout. Analysts noted that while whales’ behavior suggests that accumulation could bring bullish signals, macro risks still need to be watched.
MarketWhisper1h ago
Dogecoin ETF Sees Zero Inflows as Traders Hold Through Dip
Key Insights
The Dogecoin ETF recorded zero inflows for eight straight days despite price volatility, signaling hesitation among institutional-style investors toward meme coin exposure products.
Traders accumulated millions of DOGE during price dips, indicating continued confidence in the
CryptoFrontNews1h ago
Bitcoin Might Never Drop Below $59K Again - U.Today
Bitcoin's 200-week moving average has crossed $59,000, solidifying its status as a crucial support level. Historically, this average has provided stability during market downturns, though rare breaches have occurred, indicating potential cycle bottoms.
UToday1h ago
