
Key Takeaways
-
Hyperliquid (HYPE) surged over 8%, reclaiming the $23.30 level amid rising market interest.
-
DefiLlama data shows Hyperliquid leading perpetual futures volume over the last 30 days, topping $160 billion.
-
Strong derivatives activity suggests sustained trader demand and growing ecosystem traction.
-
The daily chart highlights a Bearish Shark harmonic pattern, allowing room for short-term upside.
Hyperliquid’s native token, HYPE, is back in the spotlight today after posting a 8%+ price jump, pushing above the $23.30 level. While the price move itself has caught traders’ attention, a deeper look at on-chain metrics and the daily chart suggests there may be more developing beneath the surface.
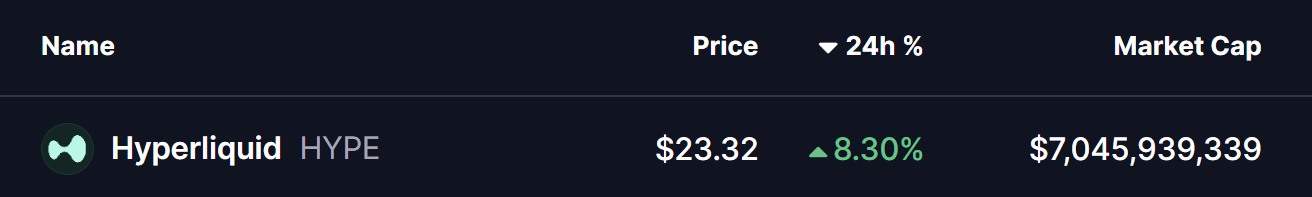
Source: Coinmarketcap
Hyperliquid (HYPE) Leads Perp Volume
According to DefiLlama data, **Hyperliquid **has emerged as the **top perpetual futures **platform by trading volume over the last 30 days, significantly outperforming its closest competitors. The protocol recorded approximately $160.4 billion in perpetual volume, comfortably ahead of Aster and Lighter, which logged around $124.7 billion and $112.5 billion, respectively.
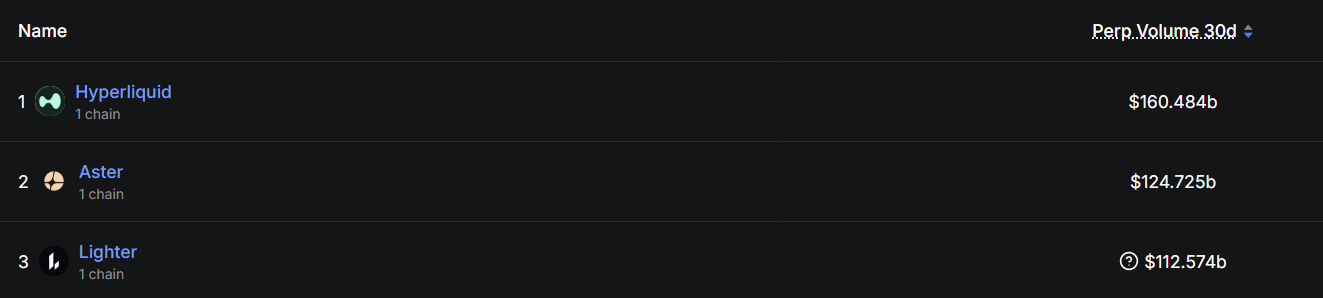
Source: Defillama
This surge in activity highlights growing trader preference for Hyperliquid’s ecosystem, signaling strong demand, deep liquidity, and sustained engagement. Historically, rising derivatives volume often acts as a leading indicator for increased interest in a project’s native token — something that appears to be playing out in HYPE’s recent price action.
Is More Upside Ahead?
From a technical perspective, HYPE’s daily chart reveals the development of a Bearish Shark harmonic pattern, a well-known formation in technical analysis. While this pattern ultimately suggests a potential reversal once fully completed, it often allows for short-term bullish continuation as price moves toward the “C” point.
Following the completion of the O-X-A-B structure, HYPE is currently trading around $23.26, holding above its recent lows. The next key challenge for bulls lies at the 50-day moving average near $25.72, which has acted as a dynamic resistance zone.
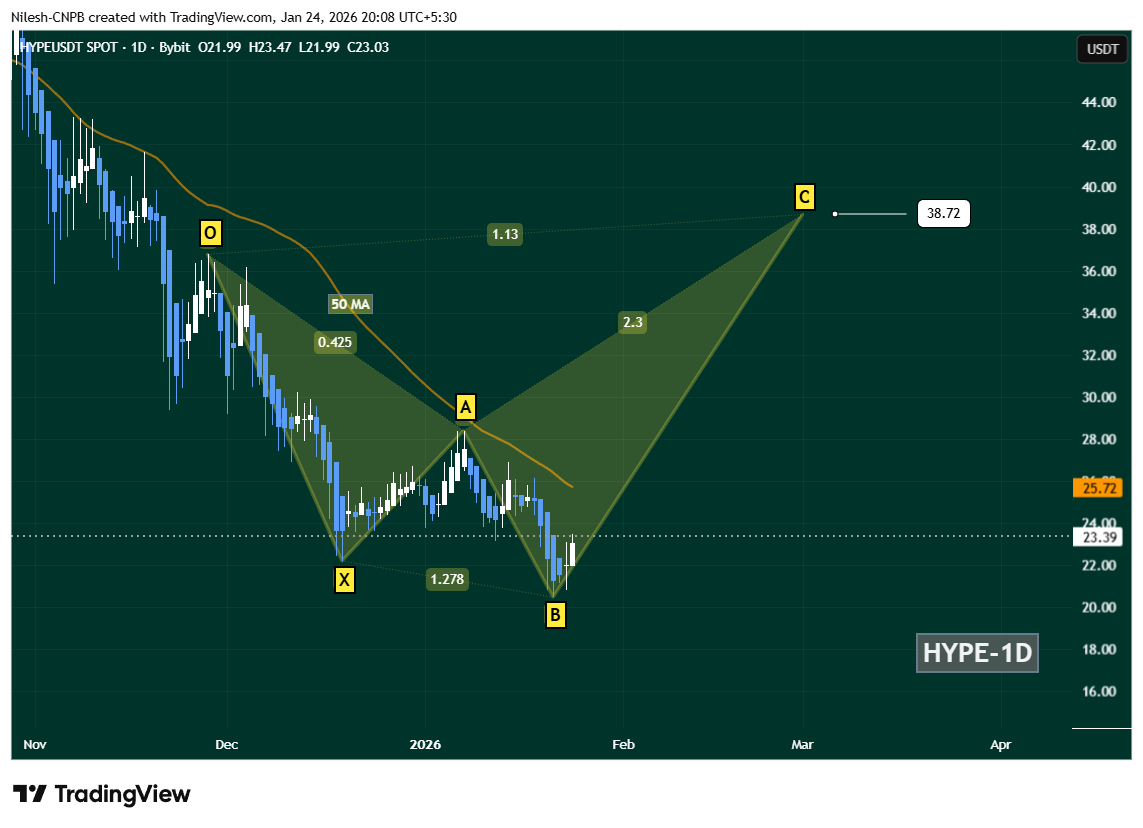
Hyperliquid (HYPE) Daily Chart/Coinsprobe (Source: Tradingview)
A decisive daily close above the 50-day MA ($25.72) would strengthen the recovery narrative and could open the door for a broader upside move. If momentum continues to build, the chart projects a potential advance toward the C-point near $38.72, aligning with the Shark pattern’s 1.13 Fibonacci extension.
However, downside risks remain. A failure to hold the B-point support zone would invalidate the bullish continuation setup and could expose HYPE to extended consolidation or further downside pressure in the near term.
Bottom Line
HYPE’s price rebound is being backed by strong on-chain fundamentals, with Hyperliquid clearly dominating the perpetual trading landscape. While the broader harmonic structure suggests caution in the longer term, short-term technicals still favor a recovery move as long as key support levels remain intact. All eyes now remain on the $25.72 reclaim, which could act as the trigger for the next leg higher.
Disclaimer: The views and analysis presented in this article are for informational purposes only and reflect the author’s perspective, not financial advice. Technical patterns and indicators discussed are subject to market volatility and may or may not yield the anticipated results. Investors are advised to exercise caution, conduct independent research, and make decisions aligned with their individual risk tolerance.
About Author: Nilesh Hembade is the Founder and Lead Author of Coinsprobe, with over 5 years of experience in the cryptocurrency and blockchain industry. Since launching Coinsprobe in 2023, he has been providing daily, research-driven insights through in-depth market analysis, on-chain data, and technical research.
Disclaimer: The information on this page may come from third parties and does not represent the views or opinions of Gate. The content displayed on this page is for reference only and does not constitute any financial, investment, or legal advice. Gate does not guarantee the accuracy or completeness of the information and shall not be liable for any losses arising from the use of this information. Virtual asset investments carry high risks and are subject to significant price volatility. You may lose all of your invested principal. Please fully understand the relevant risks and make prudent decisions based on your own financial situation and risk tolerance. For details, please refer to
Disclaimer.
Related Articles
Crypto Market Sees Continuous Downturn As Geopolitical Tensions Grow
The global crypto market is down 1.60% to $2.38T amidst escalating U.S.-Iran tensions, with Bitcoin and Ethereum experiencing declines. Notably, some smaller cryptocurrencies have surged. DeFi and NFT sectors show mixed trends, while regulatory developments emerge.
BlockChainReporter59m ago
Where Could Kaspa (KAS) Price Go This Week?
Kaspa (KAS) is showing serious resilience even as its price remains near lows. Kaspa’s hash rate is holding near all-time highs, showing miners aren’t stepping back and the network’s backbone is rock solid.
A major hardfork is coming on May 5, bringing native tokens and more programmability.
CaptainAltcoin1h ago
19.81% Surge for DUSK: What It Means for Traders
DUSK's price surged 19.81% to $0.09667 amid increased market activity and a broader altcoin shift. Analysts highlight its rising relevance and key resistance at $0.10, suggesting significant future trading interest.
Coinfomania1h ago
Bitcoin Briefly Falls Below $70,000 Mark During Asian Session as Fed Hawkishness and Macro Uncertainty Weigh on Market Volatility
Bitcoin dipped below $70,000 on March 19th, touching a low of approximately $69,537, reflecting the market's reassessment of the Federal Reserve's interest rate decision and inflation outlook. Although it later rebounded to around $70,180, the $70,000 level remains a key support in the near term. With weakening market sentiment, coupled with energy prices and macro risks, capital is turning more conservative, and Bitcoin may consolidate around the $70,000 level going forward.
区块客2h ago
XRP Enjoying 'Strong Retail Demand,' Report Says - U.Today
The essay explores the contrasting dynamics between retail and institutional demand in the cryptocurrency market. It highlights XRP's strong retail base and growing adoption, while institutional interest remains cautious, especially compared to assets like Bitcoin and Ethereum, amid recent ETF flows.
UToday2h ago
Fractal model predicts Bitcoin will hit bottom in October 2026
Bitcoin shows positive recovery signals, improving market sentiment after a long phase of volatility. However, experts believe the current uptrend is short-term, with deeper correction risks ahead. According to Crypto Rover's fractal model, Bitcoin's price follows a four-year cycle influenced by halving events. The current cycle likely peaked in late 2025, with further declines expected before a potential bottom around 2026. Short-term price fluctuations can mislead investors, emphasizing the importance of understanding these cycles for long-term trends.
TapChiBitcoin3h ago
