
Key Takeaways
-
OriginTrail (TRAC) has surged around 12% in a single day, drawing renewed attention to the token.
-
TRAC has broken out from an ascending triangle near $0.46 on the daily chart, signaling growing bullish momentum.
-
Similar breakout structures in July and October 2025 previously led to strong rallies of 63% and 113%.
-
Holding the $0.44–$0.46 zone as support will be crucial to keep the bullish fractal setup intact.
-
If the pattern plays out, TRAC could attempt a move toward its long-term ascending resistance above $1.00.
OriginTrail, the decentralized knowledge graph protocol, is stepping back into the spotlight as its native token TRAC records a strong 12% daily surge. Beyond the price jump, the real signal is coming from the charts, where a familiar fractal breakout structure is starting to emerge on the daily timeframe, hinting that a larger upside move could be forming.
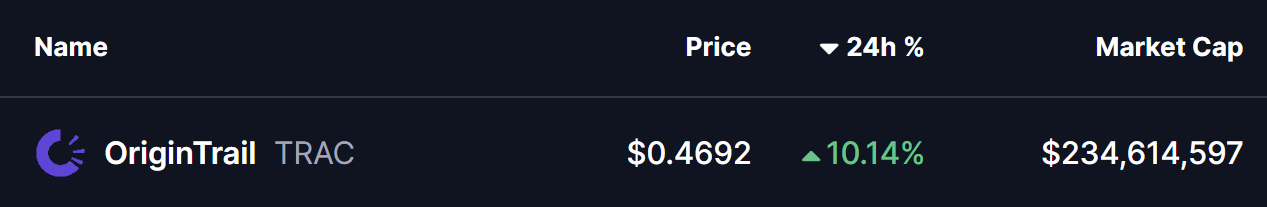
Source: Coinmarketcap
Fractal Breakout Hints at Potential Upside Move
On the daily chart, TRAC has confirmed a breakout from an ascending triangle pattern near the $0.46 level. This breakout is particularly important as price is now trading just above the 200-day moving average, a level that has historically acted as a major trend-defining zone for TRAC.
What makes this setup more compelling is its similarity to previous breakout phases. In late July 2025, a comparable structure resulted in a 63% upside move after price held above its breakout base. Later, in early October 2025, TRAC broke out from a right-angled descending broadening wedge pattern. That move was followed by a reclaim of the 200-day moving average and ultimately led to a powerful 113% rally.
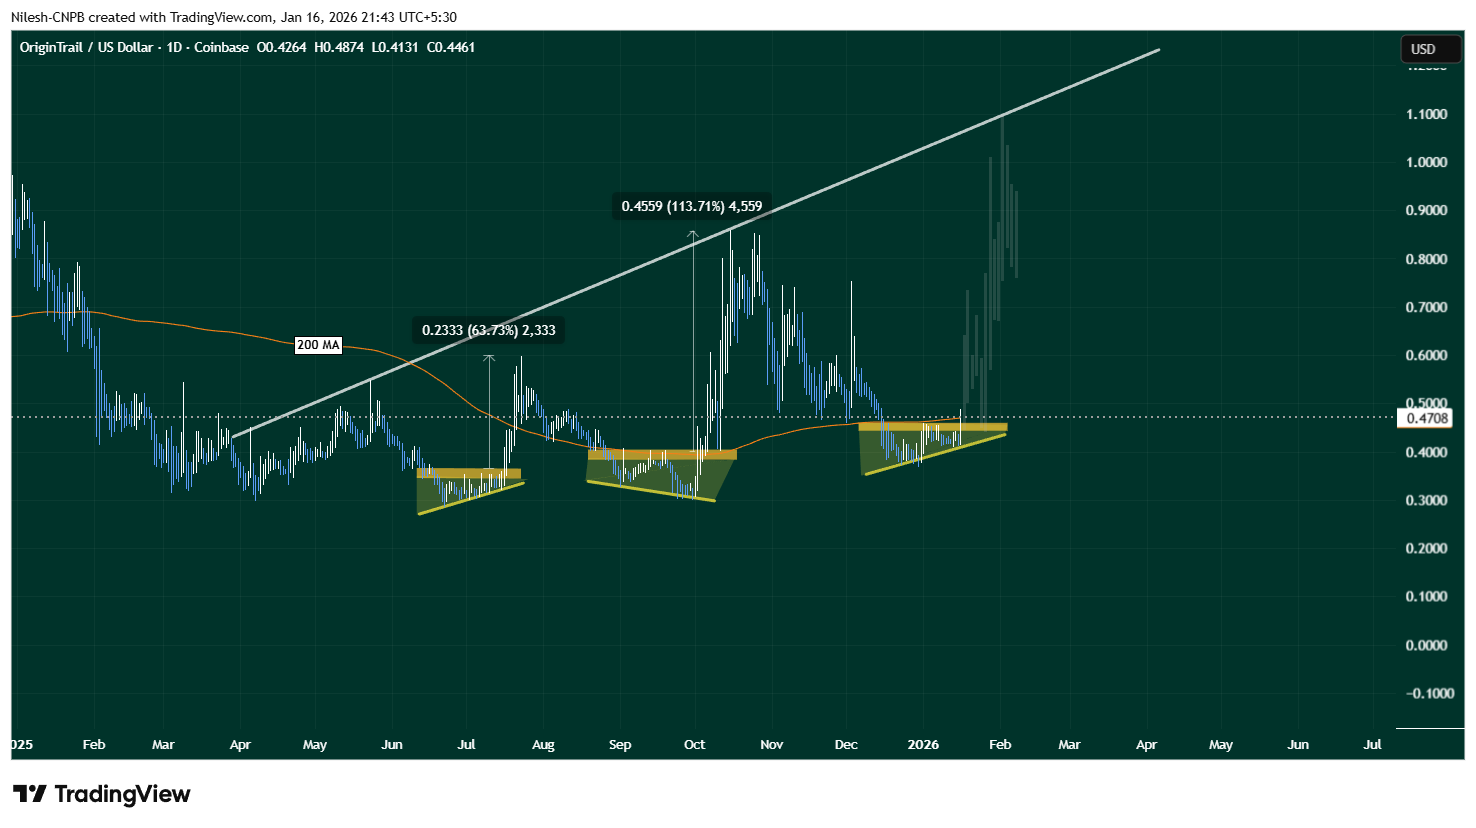
OriginTrail (TRAC) Daily Chart/Coinsprobe (Source: Tradingview)
The current setup shares key characteristics with those earlier moves. Price compression, a clean breakout, and interaction with the 200-day MA suggest that TRAC may once again be transitioning from consolidation into expansion.
What’s Next for TRAC?
If this fractal breakout plays out as expected, holding the $0.44–$0.46 zone as support will be crucial. A sustained hold above this range, along with continued strength above the 200-day moving average, could act as a launchpad for further upside.
In that scenario, TRAC may attempt a move toward its long-term ascending resistance trendline, which currently sits above the $1.00 level. A push toward that zone would align closely with the magnitude of prior fractal-driven rallies seen on the chart.
That said, fractal patterns are never guarantees. Broader market conditions, liquidity, and overall sentiment will continue to influence price action. A failure to hold the $0.44–$0.46 support zone or a rejection back below the 200-day moving average could invalidate the breakout and weaken the bullish fractal thesis.
Bottom Line
TRAC is showing early signs of another technically significant breakout, supported by historical fractal behavior and a reclaim of a key long-term moving average. If buyers can defend the current support zone, the chart suggests that OriginTrail may be positioning itself for a larger upside move in the weeks ahead.
Disclaimer: The views and analysis presented in this article are for informational purposes only and reflect the author’s perspective, not financial advice. Technical patterns and indicators discussed are subject to market volatility and may or may not yield the anticipated results. Investors are advised to exercise caution, conduct independent research, and make decisions aligned with their individual risk tolerance.
About Author: Nilesh Hembade is the Founder and Lead Author of Coinsprobe, with over 5 years of experience in the cryptocurrency and blockchain industry. Since launching Coinsprobe in 2023, he has been providing daily, research-driven insights through in-depth market analysis, on-chain data, and technical research.
Disclaimer: The information on this page may come from third parties and does not represent the views or opinions of Gate. The content displayed on this page is for reference only and does not constitute any financial, investment, or legal advice. Gate does not guarantee the accuracy or completeness of the information and shall not be liable for any losses arising from the use of this information. Virtual asset investments carry high risks and are subject to significant price volatility. You may lose all of your invested principal. Please fully understand the relevant risks and make prudent decisions based on your own financial situation and risk tolerance. For details, please refer to
Disclaimer.
Related Articles
Shiba Inu Tests Key Resistance as Reversal Signals Build
Key Insights
Shiba Inu shows early reversal signals as price forms higher lows and compresses under resistance, reflecting a shift toward controlled accumulation behavior.
The 50 EMA remains a decisive level, with a sustained move above it likely to confirm momentum change and attract
CryptoNewsLand21m ago
Bitcoin dips 3% as analysis says $70K BTC price 'not obviously bearish'
Bitcoin (BTC) daily losses approached 3% at Thursday’s Wall Street open as markets stayed on edge over fresh Iran tensions.
Key points:
Bitcoin slips from $70,000 as markets continue to observe Iran developments.
Inflation and recession worries grow louder with no clear end to the
Cointelegraph26m ago
BTC long-term holder profit indicator drops below 1.0
Gate News reports that on March 26, according to on-chain data analysis by CryptoQuant analyst nino, the Bitcoin Long-Term Holder Profit Ratio (LTH-SOPR) recently dropped below 1.0. LTH-SOPR specifically tracks the actual profit and loss status of long-term investors holding coins for over 155 days. A value above 1.0 indicates that the overall holders are selling at a profit, while below 1.0 suggests long-term holders are exiting at a loss.
GateNews29m ago
Bitunix Analyst: Mismatch between energy control, monetary tightening, and war escalation; liquidity shifts toward a squeezing range
The global market is experiencing intertwined impacts from three main factors: the U.S. easing oil and gas restrictions to suppress energy prices, rising interest rates in Japan, and tense Middle East tensions. This situation is disrupting traditional pricing, causing capital flows to shift from financial assets to physical and strategic resources. For the crypto market, Bitcoin (BTC) reflects risk appetite, with prices fluctuating between $69,000 and $72,000. Its future trend will be influenced by macroeconomic factors.
BlockBeatNews41m ago
Chainlink price stuck at $9 – But a $14.8 million buy by a major investor raises many questions
Chainlink (LINK) has maintained a narrow trading range between $8.5 and $9.9 throughout the week, with the $9.9 level continuing to act as a significant resistance. At the time of writing, the price is trading around $9.2, up slightly by 1.23% on the daily timeframe.
However, trading volume has dropped sharply by 32% to a level of
TapChiBitcoin55m ago
Bitcoin Shows Bearish Signals While Market Onlookers Say Bottom Remains Far Off
Bitcoin's price is currently $70,535.38, with a slight decrease of 0.51%. Despite bearish signals in technical indicators and ongoing market caution, experts stress that it is premature to declare a market bottom. Future trends will determine the trajectory.
BlockChainReporter58m ago
