
Pump.fun (PUMP) has been cooling off during the past 3 days, yet the broader structure on the chart suggests the story may not be finished. Price action shows that PUMP had already recorded more than an 80% rise before the recent pullback, which makes the current pause look more like a breather than a breakdown. That slow but upward move that began toward the end of December is still visible when the chart is viewed as a whole.
Early price behavior matters here. PUMP spent weeks drifting lower before finding a base near the $0.0020 area. From that zone, price began forming higher lows, followed by a gradual push upward. The recent decline has not erased that structure, which is why this cooling phase is drawing attention rather than concern.
Pump.fun Price Analysis Shows A Shift After Long Term Downtrend Break
A closer look at the daily chart highlights a major technical shift. Pump.fun price recently moved above a long-term descending trendline that had capped upside attempts for months. That break often changes how a market behaves, since former resistance can start acting as support.
According to Crypto Patel, this break places PUMP inside what he describes as a bullish expansion zone. His analysis points to a completed distribution and correction phase, followed by early reversal signals. That interpretation lines up with the chart, where price stopped making lower lows and began stabilizing above the $0.0020 level.
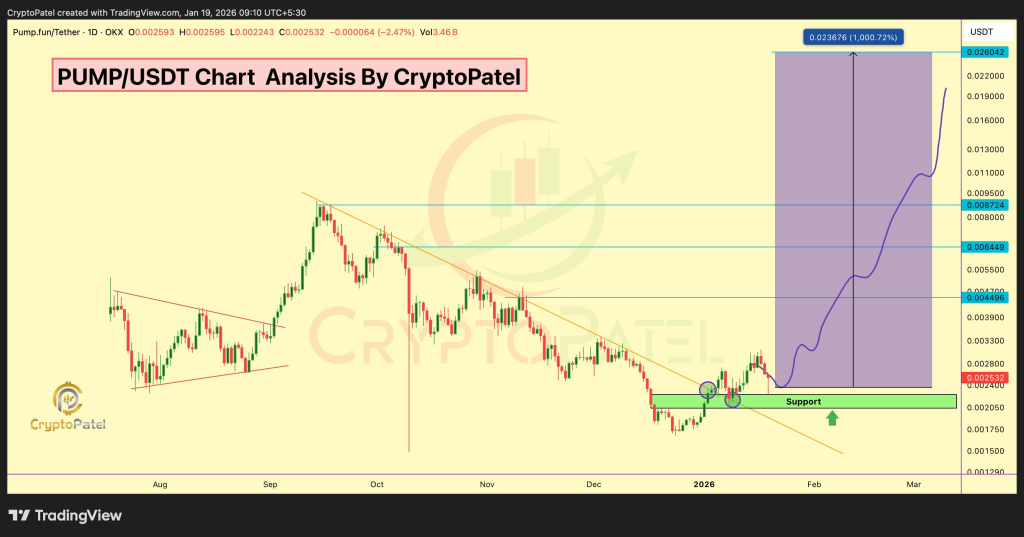
@CryptoPatel / X
The attached chart also shows a descending wedge structure that resolved to the upside. That pattern often appears near the end of corrective phases, especially when volume starts to improve and downside momentum fades.
PUMP Price Holds Key Demand Zone That Supports Bullish Structure
One of the most important areas on the chart sits between $0.0020 and $0.0022. That zone has acted as a strong demand region, with multiple tests that failed to push price decisively lower. Each successful hold adds weight to the idea of accumulation rather than distribution.
Crypto Patel emphasizes that PUMP price remaining above $0.0020 keeps the bullish bias intact. The chart supports this view, since price has reclaimed support levels that previously acted as resistance. Those reclaims often signal that buyers are willing to step in earlier than before.
Why Bittensor (TAO) Could Be One of the Most Important AI Cryptos Ever Built_**
When projecting forward, the chart highlights several technical levels that stand out. Crypto Patel outlines upside zones around $0.00872, $0.015, and $0.026. From current levels, those targets imply a potential 500% to 1000% move if momentum continues building.
That potential does not come without risk, which is why the invalidation point matters. A daily close below $0.0020 would weaken the bullish structure and challenge the current PUMP price prediction. Until that happens, the chart continues to favor higher levels over time.
Disclaimer: The information on this page may come from third parties and does not represent the views or opinions of Gate. The content displayed on this page is for reference only and does not constitute any financial, investment, or legal advice. Gate does not guarantee the accuracy or completeness of the information and shall not be liable for any losses arising from the use of this information. Virtual asset investments carry high risks and are subject to significant price volatility. You may lose all of your invested principal. Please fully understand the relevant risks and make prudent decisions based on your own financial situation and risk tolerance. For details, please refer to
Disclaimer.
Related Articles
ETH SuperTrend Turns Green but $2,400 Stays Unbroken
_Ethereum’s daily SuperTrend flipped bullish for the first time since May 2024, but $2,400 resistance keeps blocking any real breakout attempt. Is ETH ready?_
Ethereum ran into a wall. Again. After weeks of grinding between $1,750 and $2,150, ETH finally broke above the range ceiling, pushed into t
LiveBTCNews4m ago
Why XRP Price Risks Further Decline Despite Recovery Signs
Recent XRP price action shows a market that looks steady on the surface but still carries underlying pressure. XRP currently trades around $1.43, up about +0.70% over the past 24 hours and roughly +2.33% across 30 days, yet it remains down about 3.97% over the past week.
That mixed
CaptainAltcoin24m ago
K33: Bitcoin Consolidation Range Selling Pressure Weakens, Market May Be Transitioning from Distribution Phase to Bottom-Building Phase
K33 research report states that Bitcoin has recently oscillated within the $60,000 to $75,000 range, with weakening selling pressure in the market, displaying characteristics of establishing a bottom. Long-term holders tend to accumulate coins, which helps stabilize prices, but macroeconomic uncertainty remains, which may impact risk appetite and capital inflows.
GateNews50m ago
Bullish Signal for Altcoin Price Pump Flares, Crypto Community Expects Altseason to Commence Soon
Bullish signal for altcoin price pump flares.
Expert highlights two bullish signals of altcoin and BTC price charts.
Crypto community expects altseason to commence soon.
The crypto community has been waiting for the altseason peak phase for what feels like over two years now, as the pri
CryptoNewsLand1h ago
