
Key Takeaways
-
Near Protocol (NEAR) is gaining momentum, with price up nearly 18% over the past 30 days.
-
The daily chart shows a well-defined inverse head and shoulders pattern, signaling a potential bullish reversal.
-
NEAR is consolidating just below a key neckline resistance zone between $1.79 and $1.88.
-
Reclaiming the 100-day moving average near $1.96 would strengthen the bullish breakout case.
-
A confirmed breakout could open the door toward the $2.36 upside target.
-
Failure to hold above the $1.65 support zone may lead to further consolidation and delay the bullish setup.
The cryptocurrency market’s AI narrative has been gaining renewed traction, and Near Protocol (NEAR) is emerging as one of the standout performers. Over the past 30 days, NEAR has surged nearly 18%, and beyond the price action, the project continues to strengthen fundamentally.
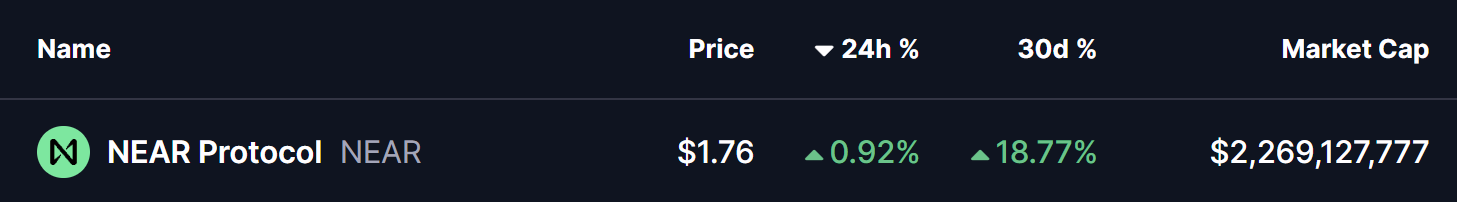
Source: Coinmarketcap
NEAR currently ranked as the third most active blockchain by 38.9 monthly users, trailing only BNB Chain and Solana — a signal that on-chain usage and developer activity remain strong.
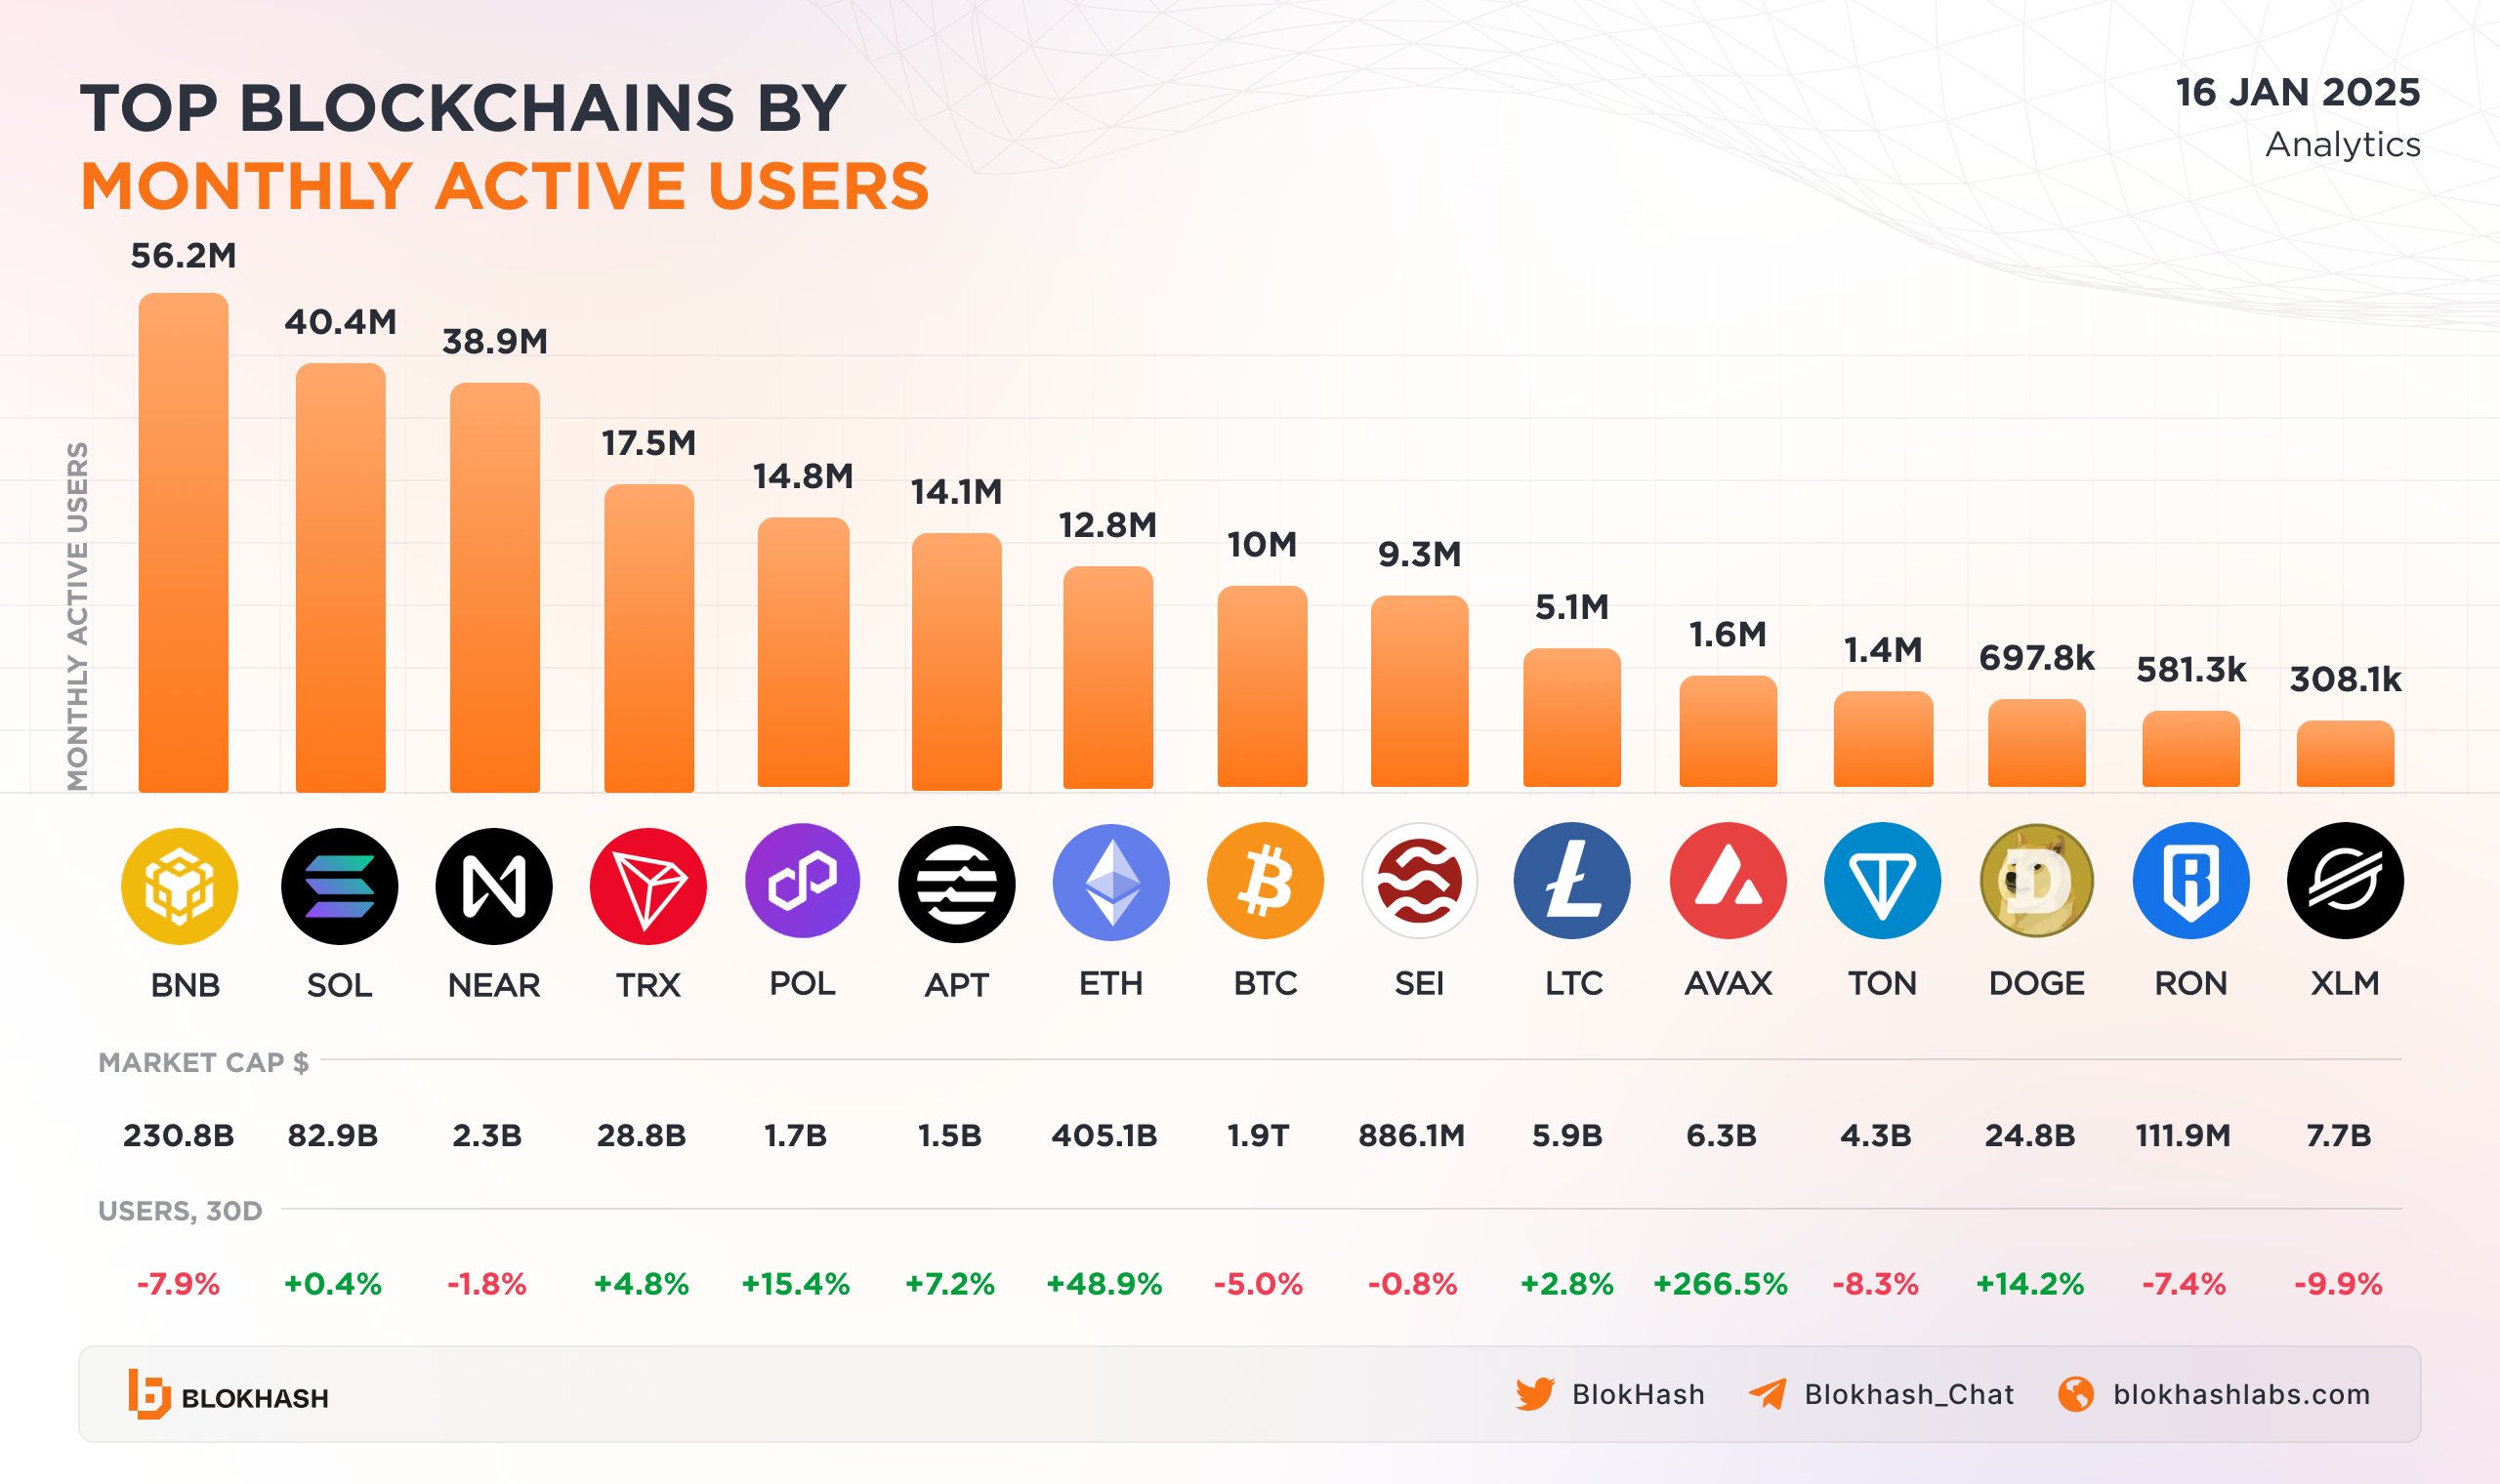
Top 10 Blockchains By Active Users/Source: @BlokHash (X)
More importantly, the daily chart is now revealing a classic bullish reversal structure, suggesting that NEAR could be positioning itself for a meaningful upside continuation.
Inverse Head and Shoulders Pattern Takes Shape
On the daily timeframe, NEAR has formed a well-defined inverse head and shoulders pattern, a setup widely regarded as one of the most reliable bullish reversal formations in technical analysis.
-
The left shoulder developed in early December near the $1.65 region, where selling pressure temporarily paused.
-
This was followed by a deeper decline toward the $1.45 area, forming the head, as broader market weakness weighed on price.
-
The right shoulder then emerged as NEAR once again found support near $1.65, signaling that sellers were losing control.
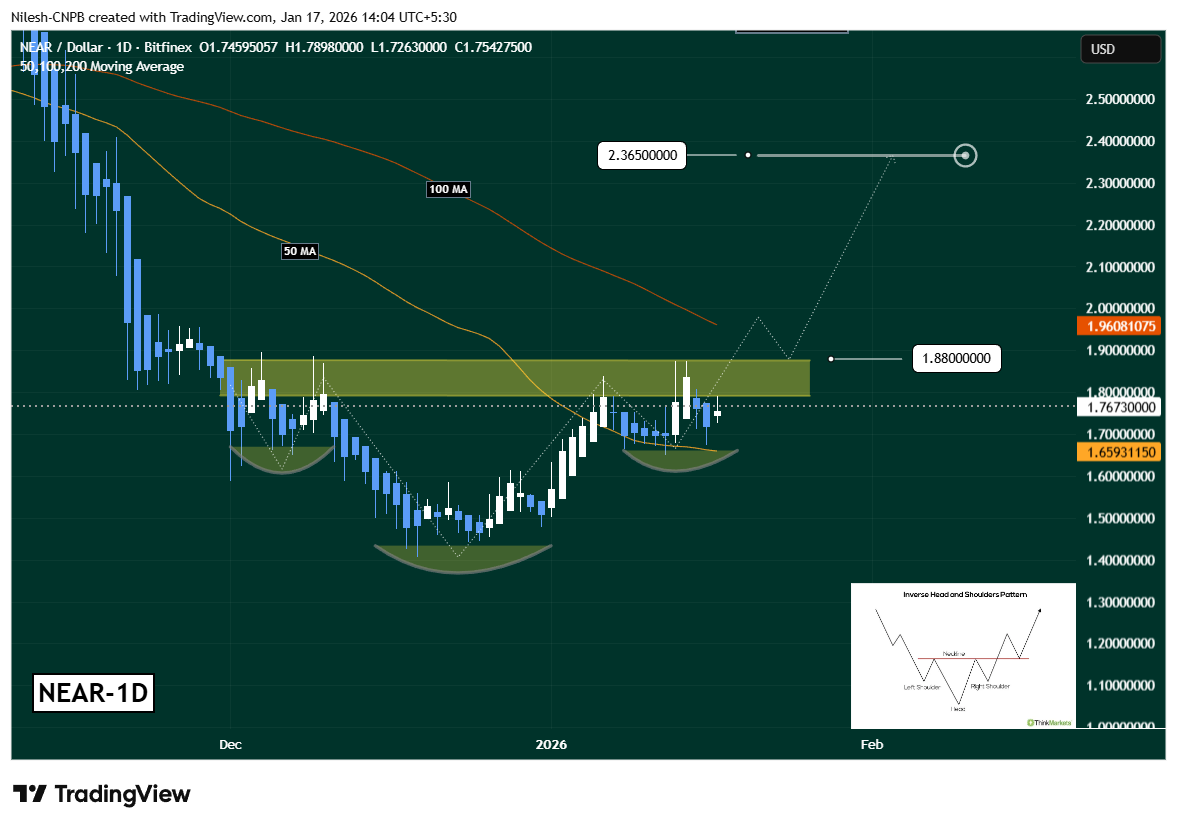
Near Protocol (NEAR) Daily Chart/Coinsprobe (Source: Tradingview)
Since completing this structure, NEAR has rebounded steadily and successfully reclaimed the 50-day moving average, which is now acting as dynamic support. At present, price is consolidating just below a key neckline resistance zone between $1.79 and $1.88, clearly highlighted on the chart.
This compression near resistance often precedes a volatility expansion, suggesting that a decisive move could be approaching.
What’s Next for NEAR?
For bullish momentum to gain confirmation, NEAR needs a strong daily close above the $1.79–$1.88 neckline, ideally followed by a successful retest of this zone as support. Such a move would validate the inverse head and shoulders breakout and confirm a shift in short-term market structure.
Additional strength would come from reclaiming the 100-day moving average near $1.96, which has capped price during the recent downtrend. A break above this level could accelerate upside momentum as sidelined buyers step back in.
If these conditions are met, the measured move projection from the inverse head and shoulders pattern points toward the $2.36 region, representing a potential upside of roughly 26% from the breakout area.
On the downside, failure to clear the neckline could lead to further consolidation. In that scenario, holding above the 50-day moving average and the $1.65 support zone will be crucial to keep the bullish structure intact. A loss of these levels would delay the breakout thesis and shift focus back to range-bound price action.
Bottom Line
NEAR Protocol appears to be coiling beneath resistance, supported by a textbook bullish reversal pattern and improving broader sentiment. While confirmation is still needed, the technical structure suggests accumulation rather than distribution, with buyers gradually gaining control.
Disclaimer: The views and analysis presented in this article are for informational purposes only and reflect the author’s perspective, not financial advice. Technical patterns and indicators discussed are subject to market volatility and may or may not yield the anticipated results. Investors are advised to exercise caution, conduct independent research, and make decisions aligned with their individual risk tolerance.
About Author: Nilesh Hembade is the Founder and Lead Author of Coinsprobe, with over 5 years of experience in the cryptocurrency and blockchain industry. Since launching Coinsprobe in 2023, he has been providing daily, research-driven insights through in-depth market analysis, on-chain data, and technical research.
Disclaimer: The information on this page may come from third parties and does not represent the views or opinions of Gate. The content displayed on this page is for reference only and does not constitute any financial, investment, or legal advice. Gate does not guarantee the accuracy or completeness of the information and shall not be liable for any losses arising from the use of this information. Virtual asset investments carry high risks and are subject to significant price volatility. You may lose all of your invested principal. Please fully understand the relevant risks and make prudent decisions based on your own financial situation and risk tolerance. For details, please refer to
Disclaimer.
Related Articles
Cardano Prints Bullish Double Bottom Pattern, $5 ADA ATH Expected as Most Altcoin Charts Remain Strong
Cardano prints bullish double bottom pattern.
$5 ADA ATH price could be hit this year.
Most altcoin price charts remain strong, signaling bull pumps ahead.
The crypto community continues to watch several altocin price charts to mange their expectations for a bullish altseason peak
CryptoNewsLand24m ago
Analyst Says the Lower XRP Goes the More Bullish the Breakout as Experts Remain Unsure About XRP Recovery
Analyst says the lower XRP goes the more bullish the breakout.
Other experts remain unsure about an XRP recovery.
Can the price of XRP set a new ATH this year?
The crypto market sees renewed hope and improved anticipation of a bullish recovery rally as the price of BTC just reclaimed pri
CryptoNewsLand1h ago
Bitcoin buyers gobbled up nearly 850,000 BTC between $60,000 and $70,000
Despite recent fluctuations, Bitcoin's strong dip demand is evident as 1.84 million BTC was traded below $70,000, representing 9.23% of its circulating supply, indicating potential price support. In contrast, trading activity above $70,000 remains lower.
CoinDesk2h ago
Crypto markets rally as Trump announces two-week Iran ceasefire
The crypto market enjoyed a much-needed boost on Tuesday evening after U.S. president Donald Trump announced a two-week ceasefire in Iran.
Bitcoin BTC$71,640.51 spiked to around $72,700 after settling in the $71,800 region, ether (ETH), meanwhile, is changing hands at $2,250 after posting a 6%
CoinDesk3h ago
Retail buy orders fell from higher levels by 50%, and April presents an opportunity for a rebound in risk assets
In March, retail investors shifted toward stock sellers, and buy order volume fell nearly 50%. Despite bearish market sentiment, seasonal factors and ceasefire-related news may prompt the market to rebound in the second quarter, and investors should pay particular attention to the energy, technology, and crypto asset sectors.
GateNews3h ago
Ethereum rebounds to $2,257 as network stablecoin supply surpasses $180 billion, setting a new all-time high
Fueled by a ceasefire agreement between the United States and Iran, the price of Ethereum rose by about 9% on Wednesday, reaching a new high in several weeks. At the same time, stablecoin supply hit a historical high, suggesting increased activity across the Ethereum ecosystem. Analysts believe this provides solid support for Ethereum, and investors should watch macro events and changes in technical indicators.
GateNews3h ago
