Author: Our Crypto Talk
Translation: Yuliya, PANews

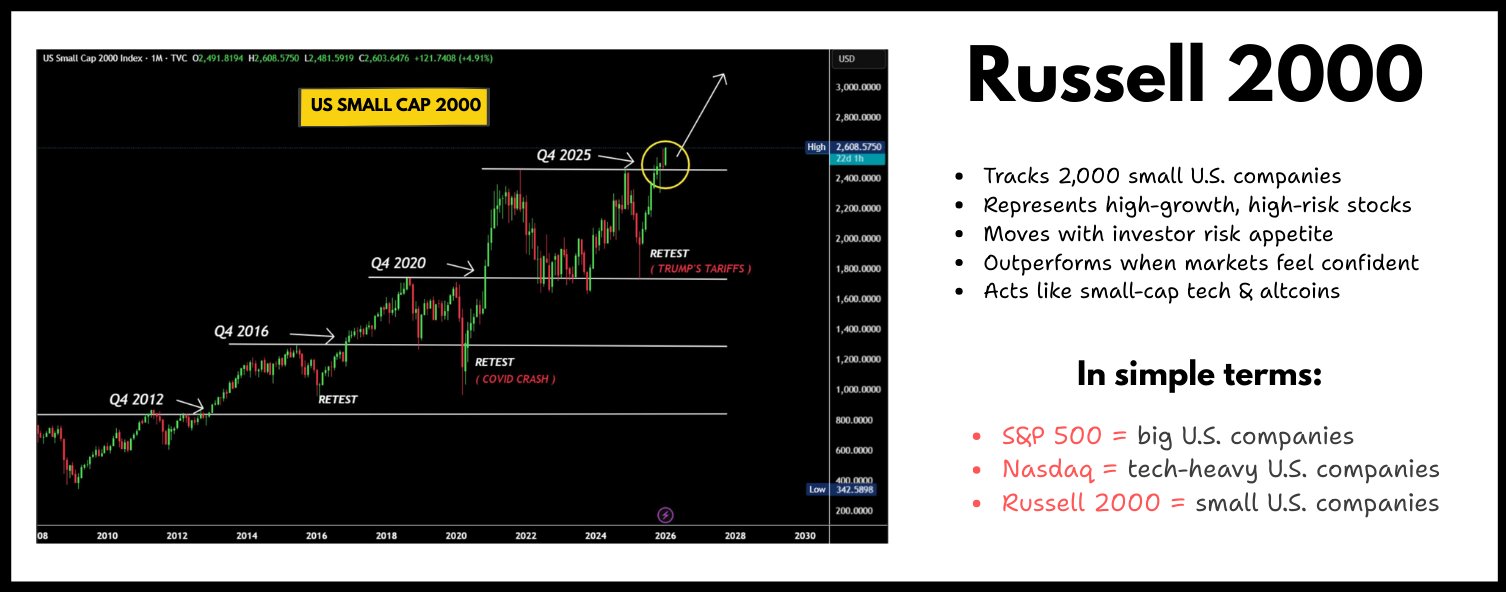
This article is not about a cryptocurrency chart, nor about a Meme coin narrative, and is temporarily unrelated to Bitcoin. We are focusing on the Russell 2000 Index quietly accomplishing a feat that has only happened twice in its history: breaking through and thereby driving a return of risk appetite.
If you have been in the market long enough, you’ve seen this “movie” more than once.
A pattern that most people continue to overlook
History always repeats itself. Even if you don’t believe in cycles, you should respect this repetition.
- In 2017, the Russell 2000 Index broke through, followed by the arrival of the “Altcoin Season.”
- In 2021, the Russell 2000 Index broke through again, and the “Altcoin Season” played out once more.
Although each market narrative is different each time, and the popular tokens vary, the underlying driving mechanism remains the same.
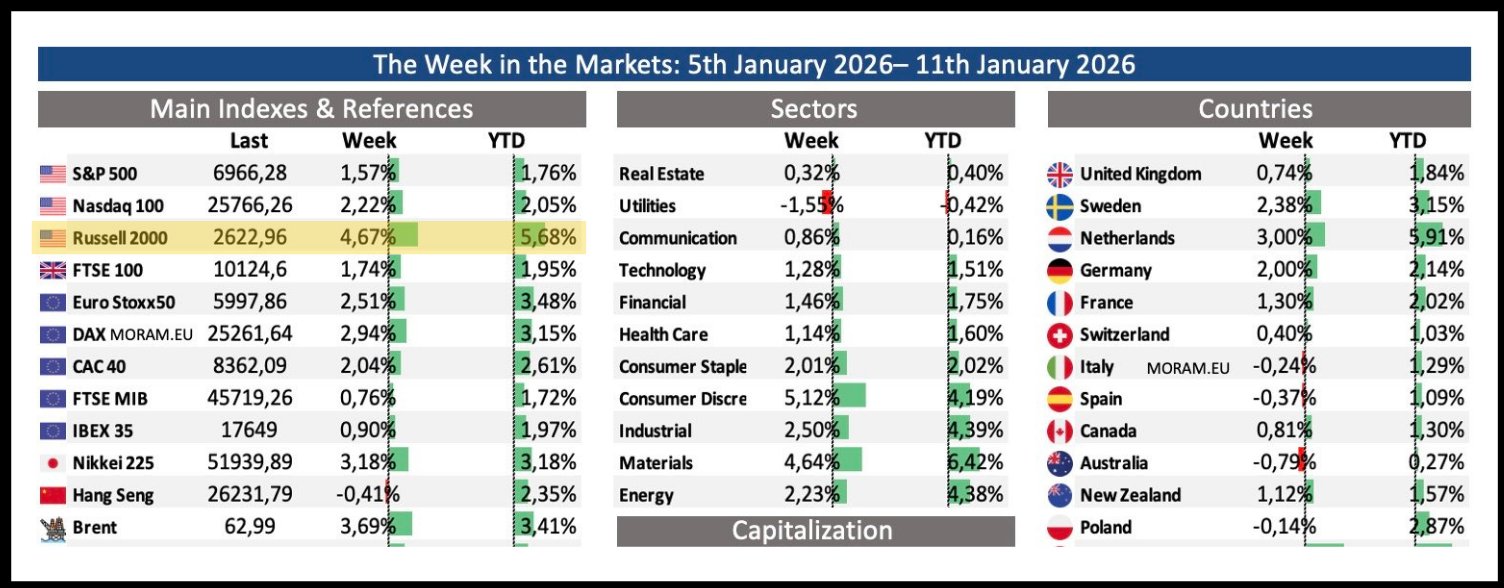
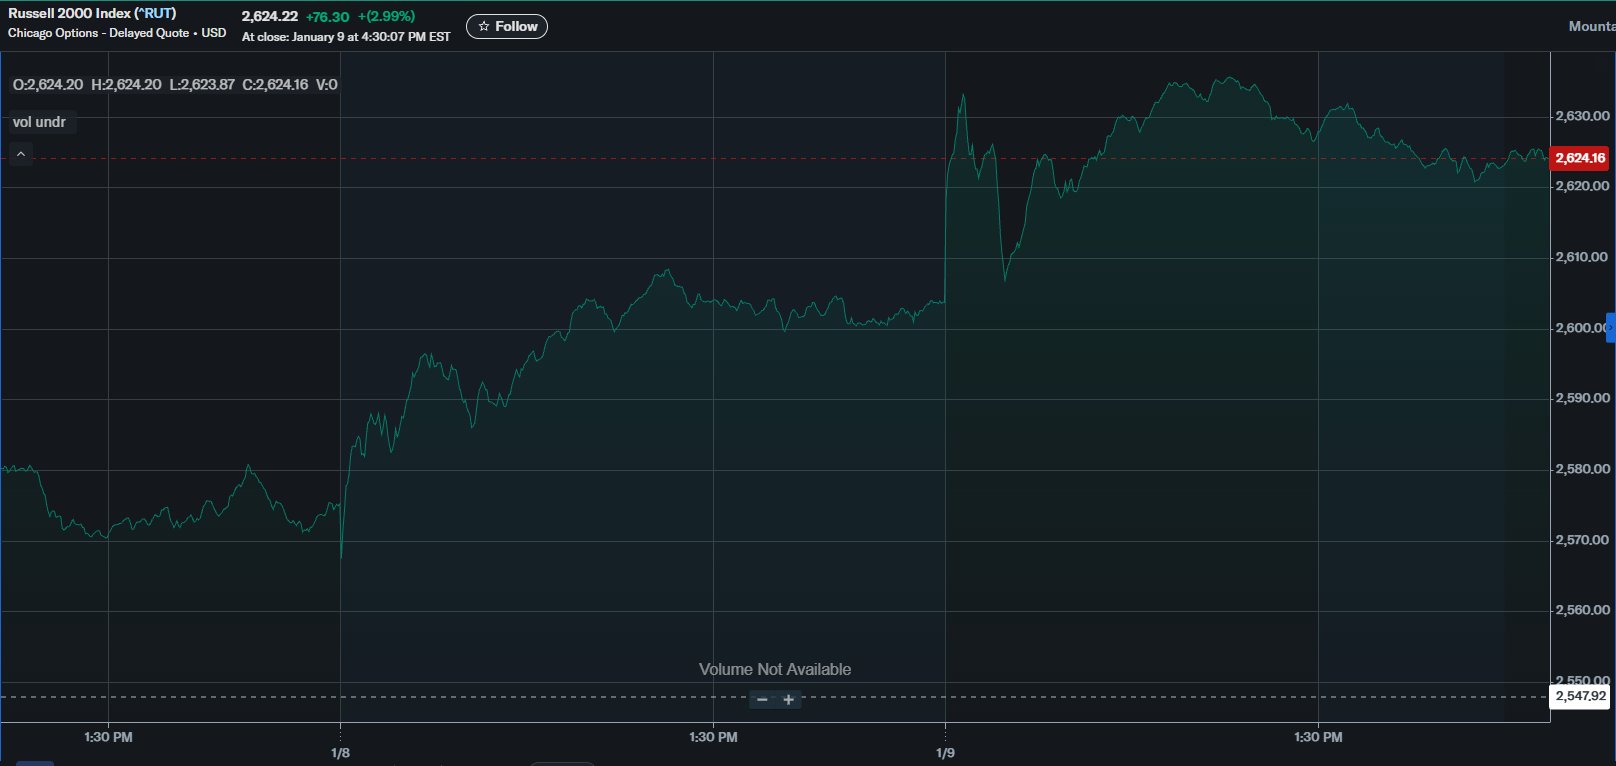
Now, in January 2026, the Russell Index has broken through 2,600 points for the first time in history.
This breakout is not an illusion, nor a false move caused by light trading during holidays, but a comprehensive breakout with huge trading volume and broad participation. The index has gained about 15% since the beginning of the year.
What does the Russell Index truly represent?
Trading in small caps is not based on market sentiment or feelings but is a liquidity-driven trade.
The Russell Index tracks about 2,000 smaller U.S. companies, including regional banks, industrial firms, biotech companies, and more. The survival and growth of these companies are closely related to borrowing conditions and growth expectations.
- When liquidity tightens, these companies suffer heavily.
- When liquidity is loose, they lead the entire market.
That’s why, in defensive markets, the Russell Index never leads the charge; but when risk appetite returns, it often becomes the leader. Therefore, the index’s breakout is not just a technical phenomenon; it’s a clear signal: capital is moving down the risk curve, seeking higher returns.
This is not an isolated case: macroeconomic context supports it.
Zooming out, you’ll find that the current macro environment fits this trend in an unsettling way.
- The Federal Reserve is quietly supporting the market reserves by purchasing Treasury bonds. While not full-scale quantitative easing (QE), it alleviates funding pressures and injects liquidity into the credit markets.
- The U.S. Treasury is reducing its TGA (Treasury General Account) balance, which means cash is being pushed back into circulation rather than withdrawn.
- Fiscal policy is gradually easing at the margin, with larger tax refunds, potential consumer subsidies, and lowering mortgage rates through bond purchases, thereby freeing up household and corporate balance sheets.
Individually, none of these measures are strong “stimulus” signals. But collectively, they form a powerful liquidity waterfall. And liquidity is never static.
The true transmission path of liquidity
This is a common misconception. Liquidity does not simply “transfer” from cash to competing assets out of thin air; it follows a certain order and hierarchy:
- First, it stabilizes bond and financing markets.
- Then, it pushes up the stock market.
- Next, it seeks higher beta (high risk, high reward) assets within the stock market.
- Only after that does it spill over into alternative asset classes.
Small caps are in the middle of this chain. They are riskier than mega caps but are logically clear and easy for institutional investors to understand. When small stocks start outperforming the market, it usually means capital has crossed the “safety” zone and is now chasing “growth.”
That’s why the Russell Index’s breakout has historically always foreshadowed broader risk asset expansion. It’s not coincidence but a mechanical, inevitable transmission process.
The position of cryptocurrencies in this process
The crypto market is not a leader in the liquidity cycle but an amplifier.
When the Russell Index enters a sustained upward trend, higher beta assets tend to lag behind. Historical data repeatedly shows that ETH and competing coins usually react one to three months later.
This is not because traders are closely watching the Russell Index on platforms like TradingView, but because the same liquidity that drives capital into small caps ultimately seeks assets with higher “convexity” (i.e., the potential for large returns with relatively small risks).
And cryptocurrencies, especially in markets that have experienced capitulation, order book thinning, and exhausted sellers, are precisely the endpoint of this search. This is exactly the environment facing the crypto market in early 2026.
Why does this feel different but the essence remains unchanged?
Every cycle has its “this time is different” reasons.
- 2017 was the ICO bubble.
- 2021 was excessive leverage and market bubbles.
- 2026 is regulatory uncertainty, macroeconomic concerns, and market fatigue.
These superficial explanations change, but the rules of capital flow remain the same.
What’s different now is that the “pipeline” (i.e., infrastructure) of the market has greatly improved: clearer regulatory frameworks, institutional-grade custody standards, spot ETFs continuously absorbing market supply, and excessive leverage on the fringes of the market decreasing.
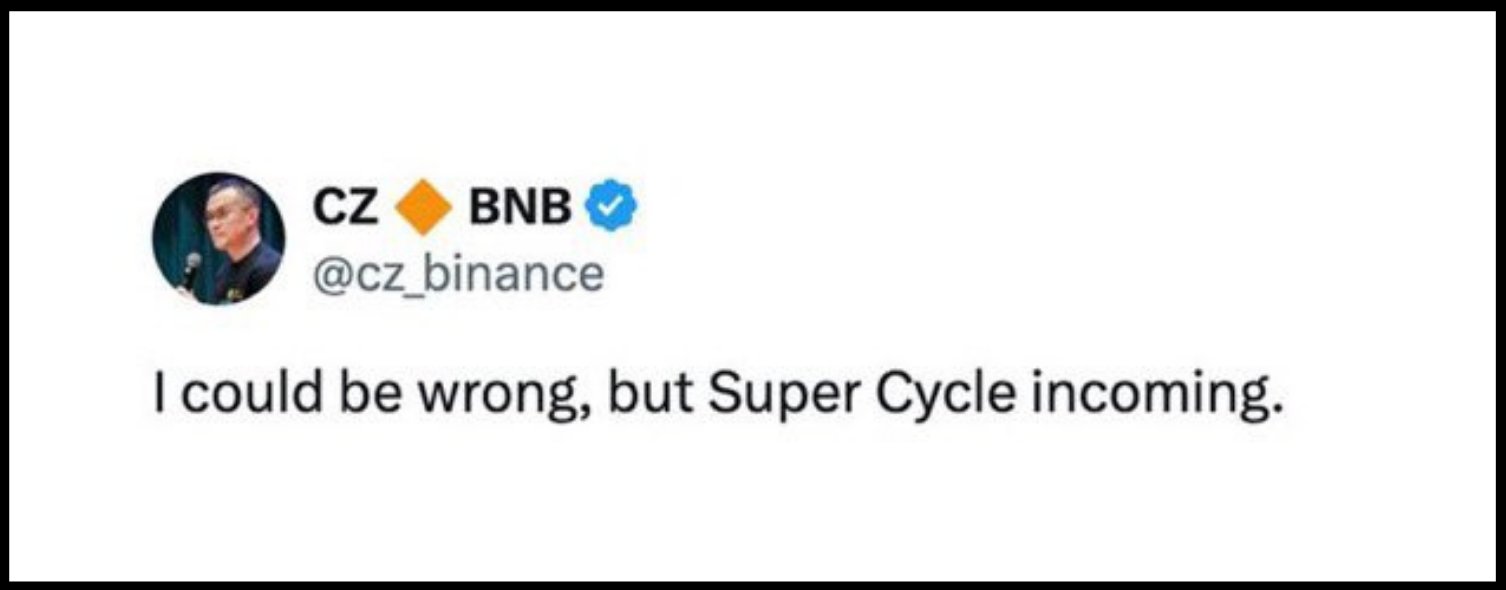
Even insiders are starting to openly discuss previously secretive viewpoints. When CZ talks about a potential “super cycle,” he’s not hyping; he’s pointing to the synergy of multiple factors: liquidity, regulation, and market structure finally moving in the same direction. This kind of synergy is extremely rare.
Mistakes crypto-native traders are making
Most crypto traders are still glued to crypto charts, waiting for confirmation signals from the market itself. But this is often too late.
When competing coins start soaring, the rotation of capital has already completed in other markets. The signal of risk appetite returning.
It first appears in markets that don’t need hype to rise. Small caps are one such market. They don’t rely on memes to pump; they rise because borrowing becomes easier and capital regains confidence.
So, if you ignore the Russell Index’s breakout because “it’s not related to crypto,” you’re missing the point entirely.
The true meaning of the “super cycle”
A “super cycle” does not mean all assets will rise forever. It implies:
- Structural support: the duration of the rally is longer than expected because it is driven by market structure rather than fleeting hype.
- Corrections are absorbed: market pullbacks are absorbed by buying, not turning into chain-reaction crashes.
- Capital rotation rather than exit: capital moves between sectors rather than leaving the market entirely.
- High-beta assets gain life: after years of suppression, high-risk, high-reward assets finally get breathing room and upward momentum.
This is precisely the environment where, in history, competing coins stop “bleeding” and start revaluing. Not all will rise, and the magnitude of gains will not be uniform, but the trend will be decisive.
Signals are on the table
The Russell Index breaking to a new high is no coincidence. When it happens, it is accompanied by easing liquidity, a return of risk tolerance, and capital decision-making resuming.
- It did so in 2017.
- It did so again in 2021.
- It is doing so now.
You don’t need to predict specific target prices or precisely time the rotation. You only need to recognize that when small caps lead the market, they are telling you what’s coming next.
The crypto market has previously ignored this signal and often regrets it months later.
Disclaimer: The information on this page may come from third parties and does not represent the views or opinions of Gate. The content displayed on this page is for reference only and does not constitute any financial, investment, or legal advice. Gate does not guarantee the accuracy or completeness of the information and shall not be liable for any losses arising from the use of this information. Virtual asset investments carry high risks and are subject to significant price volatility. You may lose all of your invested principal. Please fully understand the relevant risks and make prudent decisions based on your own financial situation and risk tolerance. For details, please refer to
Disclaimer.
Related Articles
Bitcoin and Gold Correlation Coefficient Drops to -0.88, Reaching Lowest Level Since November 2022
Gate News reports that on March 18, CryptoQuant data showed the correlation coefficient between Bitcoin and gold dropped to -0.88, hitting a new low since November 2022. The data indicates a strong negative correlation between the two, with Bitcoin's price rising to $74,000 while gold experienced a slight decline.
GateNews11m ago
XRP Begins Era as Commodity Under US Laws, Stuart Alderoty Reacts - U.Today
Stuart Alderoty, Ripple's CLO, welcomes the SEC's reclassification of XRP as a commodity, suggesting it could enhance adoption and ease exchange listings. Despite a recent price drop, XRP remains above key support levels, although trading volume has significantly decreased.
UToday38m ago
QCP: BTC Oscillates Near $74,000; Multi-Country Central Bank Rate Decisions Key This Week
QCP Capital analysis indicates that BTC price is maintaining around $74,000, with a lack of upward momentum. Although the overall crypto market remains under pressure, the declines are relatively controlled. Central bank policy meetings throughout the year will influence the market, as high oil prices have lowered expectations for rate cuts, and the interest rate environment has weakened support for crypto assets. Until policy and geopolitical situations become clearer, a volatile pattern may continue.
GateNews2h ago
Analyst: The overheated bubble of Bitcoin (BTC) has been absorbed, but selling pressure still remains.
On-chain analyst Axel's research report indicates that the Bitcoin market has returned to a neutral range, but overall remains in a loss state with unrelenting selling pressure. The MVRV Z-Score shows that valuation bubbles have dissipated; however, aSOPR has remained below 1.0 for 55 consecutive days, indicating sustained selling pressure. Axel emphasizes that the key to the market lies in whether selling pressure will be exhausted, requiring observation of whether aSOPR can stabilize above 1.0.
動區BlockTempo2h ago
Citigroup Slashes Bitcoin and Ethereum 12-Month Price Targets, Citing Stalled U.S. Crypto Legislation Weighing on Upside Catalysts
Citigroup has lowered its 12-month price targets for Bitcoin and Ethereum, signaling a shift toward caution on the cryptocurrency market's medium-term outlook, primarily due to slow progress in U.S. crypto asset legislation. Bitcoin's target was reduced from $143,000 to $112,000, while Ethereum's fell to $3,175. Despite upside potential remaining in the future, the lack of new policy catalysts suggests prices may oscillate within a range in the near term. Citigroup's assessment of Ethereum is more cautious, as it believes the asset is more significantly impacted by on-chain activity.
区块客3h ago
