
**Date: **Wed, Jan 07, 2026 | 06:20 AM GMT
The broader cryptocurrency market continues to show strong New Year momentum, with Bitcoin (BTC) up around 4% and Ethereum (ETH) gaining over 9% on a weekly basis. This improving sentiment is gradually spilling over into major altcoins — including the DePIN-focused token Akash Network (AKT).
AKT has already posted an impressive 20% weekly gain. While this short-term strength has caught traders’ attention, the more important development is unfolding on the higher-timeframe chart. Recent price action suggests a meaningful shift in market structure, hinting that AKT may be transitioning out of a prolonged corrective phase and into the early stages of a bullish continuation.
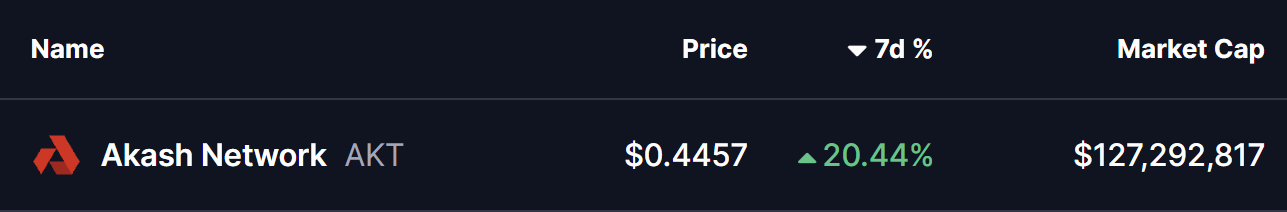
Source: Coinmarketcap
Falling Wedge and Rounding Bottom in Play
On the daily chart, AKT has been trading within a broader falling wedge — a structure that often precedes bullish reversals as selling pressure gradually weakens. Within this larger wedge, price action is also shaping a developing rounding bottom pattern, reflecting steady accumulation and seller exhaustion.
The formation began after AKT faced strong rejection near the $0.5441 resistance zone in late November. That rejection triggered a sharp sell-off, pushing price lower toward the $0.3465 region. However, bears failed to extend losses beyond this area. Instead, demand stepped in, downside momentum slowed, and price began to stabilize.
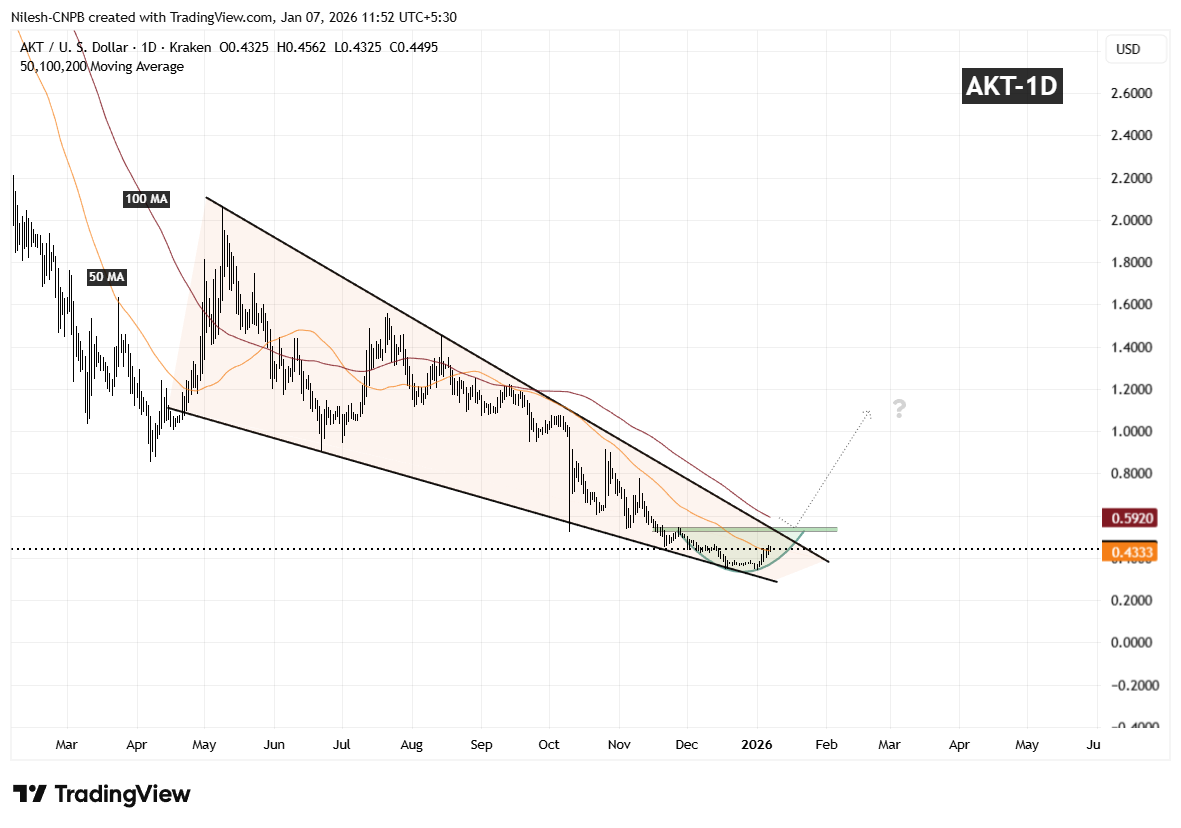
Akash Network (AKT) Daily Chart/Coinsprobe (Source: Tradingview)
Over the following weeks, volatility compressed and AKT started to curl higher in a smooth, rounded fashion — closely matching the textbook behavior of a rounding bottom. Importantly, the recent rebound has pushed price back above the 50-day moving average around $0.4333, a level that had previously acted as resistance and is now beginning to flip into support.
What’s Next for AKT?
If AKT can continue to hold above the 50-day moving average, this area may act as a solid base for further upside attempts. From here, attention shifts toward the descending resistance trendline of the falling wedge, which aligns closely with the $0.5441 resistance zone.
A clean and decisive breakout above this confluence area, followed by sustained acceptance, would confirm a broader bullish expansion phase and mark a clear trend reversal from the prior downtrend. Such a move would likely attract renewed momentum participation as the market recognizes the structural shift.
Until that breakout occurs, the pattern remains in development. Short-term consolidation or shallow pullbacks are still possible as price digests recent gains. However, as long as AKT continues to print higher lows above the established base, the broader technical structure remains constructive.
Overall, the chart suggests AKT is approaching a critical inflection point — one that could determine whether this recovery evolves into a sustained bullish trend as 2026 progresses.
Disclaimer: The views and analysis presented in this article are for informational purposes only and reflect the author’s perspective, not financial advice. Technical patterns and indicators discussed are subject to market volatility and may or may not yield the anticipated results. Investors are advised to exercise caution, conduct independent research, and make decisions aligned with their individual risk tolerance.
About Author: Nilesh Hembade is the Founder and Lead Author of Coinsprobe, with over 5 years of experience in the cryptocurrency and blockchain industry. Since launching Coinsprobe in 2023, he has been providing daily, research-driven insights through in-depth market analysis, on-chain data, and technical research.
Disclaimer: The information on this page may come from third parties and does not represent the views or opinions of Gate. The content displayed on this page is for reference only and does not constitute any financial, investment, or legal advice. Gate does not guarantee the accuracy or completeness of the information and shall not be liable for any losses arising from the use of this information. Virtual asset investments carry high risks and are subject to significant price volatility. You may lose all of your invested principal. Please fully understand the relevant risks and make prudent decisions based on your own financial situation and risk tolerance. For details, please refer to
Disclaimer.
Related Articles
Trump's Negotiation Remarks Drive US Stock Rally, Bitcoin Returns to 70K, Oil Price Plunges 15% at Once
After U.S. President Trump announced progress in U.S.-Iran negotiations, global financial markets experienced significant volatility, with U.S. stocks rising over 1%, oil prices dropping 15% at one point before stabilizing, and Bitcoin rebounding to $70,000. Although initial optimism was impacted by reports of attacks on Iranian energy facilities, the overall trend still shows market responses to risk assets. Cryptocurrency ETF fund flows indicate strong inflows into Bitcoin, while Ethereum experienced outflows.
ChainNewsAbmedia59m ago
The RWA Yield Infrastructure Trade
The essay highlights challenges in direct RWA token exposure, emphasizes the potential in leverage opportunities amid settlement delays, critiques Morpho's governance token structure, and presents Fluid as a more effective token model with stablecoin links.
CoinDesk1h ago
Trump's Easing Signals Trigger $2 Trillion Market Revaluation, Bitcoin Surges in Sync
US President Trump announced online progress in US-Iran talks and postponed strikes against Iran. Following the announcement, the S&P 500 index surged, crude oil fell sharply, and Bitcoin rose in tandem. Market reaction demonstrated high correlation across asset classes. A $1.5 billion futures order drew attention, but there is no evidence of insider trading involvement. This incident revealed the rapid repricing of global markets in response to geopolitical news.
MarketWhisper2h ago
Pi Network Weekly Drop 6%, Bullish RSI Meets Billion-Token Unlock Pressure
Pi Network has recently faced price declines, but technical indicators such as RSI approaching oversold levels and community sentiment remaining positive. Despite bullish signals, increased exchange reserves and upcoming token unlocks present bearish risks, with potential selling pressure likely to suppress prices. Market conditions require close monitoring.
MarketWhisper2h ago
U.S.-Iran War Pause News Caught in Conflicting Reports! Bitcoin Surges Back to $70K, But Analysts Warn of Bull Trap
The United States announced a pause on military strikes against Iran, causing Bitcoin to briefly break through $70,000. Analysts warn that this rally could be a bull trap, predicting Bitcoin may retest $46,000. Market sentiment remains subdued due to geopolitical risks and persistent inflation. Trump faces challenges from Iran and dollar-denominated oil prices amid internal pressure.
CryptoCity2h ago
