
**Date: **Mon, Jan 05, 2026 | 07:55 AM GMT
As 2026 kicks off, the broader cryptocurrency market is showing renewed stability. Ethereum (ETH) is up around 4% on the week, and improving sentiment is gradually spreading across major altcoins — including Ethena (ENA).
ENA has already surged more than 14% on a weekly basis, but the more important development is unfolding beneath the surface. While short-term strength is encouraging, the bigger story lies in the structure forming on the chart. Recent price action suggests a meaningful shift in market behavior — one that could mark the early stages of a bullish continuation if key resistance levels are reclaimed.
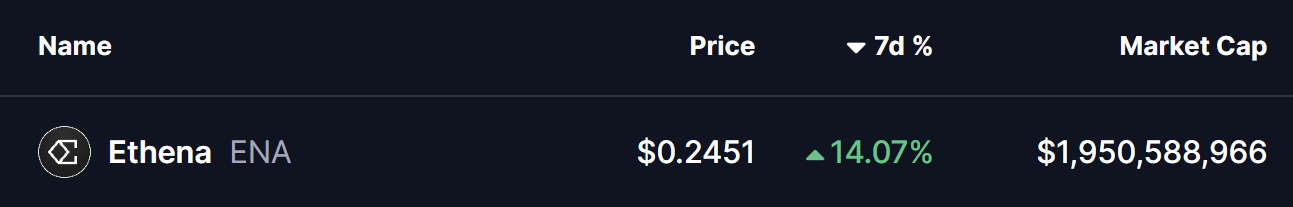
Source: Coinmarketcap
Rounding Bottom in Play
On the daily timeframe, ENA appears to be forming a rounding bottom pattern, a classic bullish reversal structure that typically develops after a prolonged corrective phase.
The setup began after ENA faced a firm rejection near the $0.3028–$0.2837 resistance zone late last month. That rejection triggered a sharp decline, dragging price down toward the $0.1935 area. Importantly, sellers failed to push price meaningfully lower from there, and strong demand emerged at those levels. Over time, ENA stabilized, volatility compressed, and price began to curl higher — completing the rounded base structure.
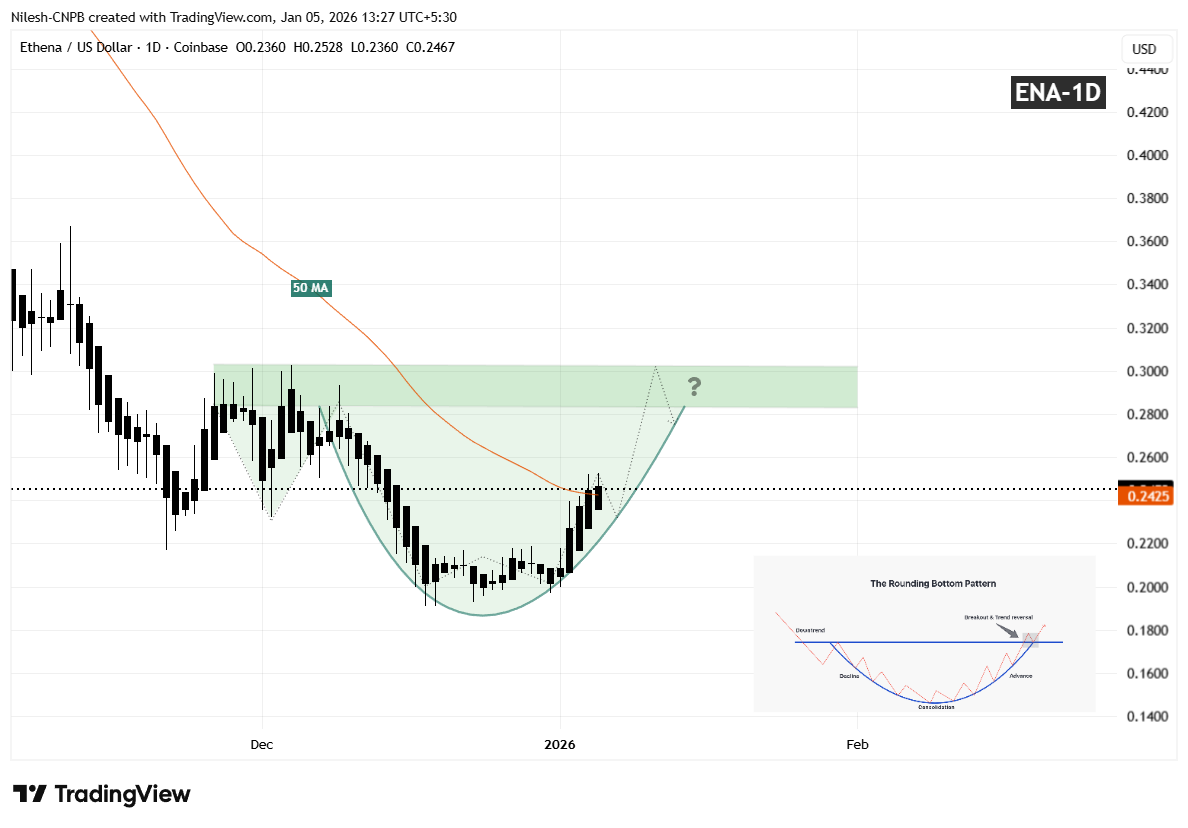
Ethena (ENA) Daily Chart/Coinsprobe (Source: Tradingview)
Since carving out that bottom, ENA has started to move higher in a smooth, rounded fashion, closely matching the textbook characteristics of a developing rounding bottom. The recent recovery has also brought price back toward the 50-day moving average near $0.2451, a level that previously acted as resistance and is now being tested as potential support.
What’s Next for ENA?
If ENA continues to hold above the 50-day MA, that level could act as a solid short-term base for further upside attempts. A clean and decisive breakout above the $0.3028–$0.2837 resistance zone, followed by sustained acceptance above it, would validate the entire reversal pattern and likely open the door for a broader bullish expansion phase.
Until such a breakout occurs, the pattern remains in development. Short-term consolidation or shallow pullbacks remain possible as price digests recent gains. However, as long as ENA continues to form higher lows above the established base, the broader bottoming structure remains intact and constructive.
For now, the chart suggests ENA is approaching a critical confirmation phase — one that could determine whether this recovery evolves into a sustained bullish trend as the new year unfolds.
Disclaimer: The views and analysis presented in this article are for informational purposes only and reflect the author’s perspective, not financial advice. Technical patterns and indicators discussed are subject to market volatility and may or may not yield the anticipated results. Investors are advised to exercise caution, conduct independent research, and make decisions aligned with their individual risk tolerance.
About Author: Nilesh Hembade is the Founder and Lead Author of Coinsprobe, with over 5 years of experience in the cryptocurrency and blockchain industry. Since launching Coinsprobe in 2023, he has been providing daily, research-driven insights through in-depth market analysis, on-chain data, and technical research.
Disclaimer: The information on this page may come from third parties and does not represent the views or opinions of Gate. The content displayed on this page is for reference only and does not constitute any financial, investment, or legal advice. Gate does not guarantee the accuracy or completeness of the information and shall not be liable for any losses arising from the use of this information. Virtual asset investments carry high risks and are subject to significant price volatility. You may lose all of your invested principal. Please fully understand the relevant risks and make prudent decisions based on your own financial situation and risk tolerance. For details, please refer to
Disclaimer.
Related Articles
XRP Faces 8% Critical Line: Can Inverse Head and Shoulders Pattern Hold Key Support?
XRP has accumulated a decline of approximately 15% since March 17, with the price currently hovering around $1.38. Technical charts suggest a potential upside breakout if support levels hold. Key resistance is at $1.45, with a further breakthrough at $1.57 testing higher levels. On the downside, support is encountered at $1.37 and $1.26. Position holders continue to increase their holdings, demonstrating support for current price levels.
GateNews2m ago
Strategy is just one "Bitcoin valuation" away from investment grade, credit rating loosening could unlock 5x market
Strive's Chief Risk Officer Jeff Walton stated that if rating agencies adjust Bitcoin valuations, Strategy could potentially jump from junk grade to investment grade, thereby gaining access to broader capital markets. He pointed out that current mainstream rating systems have significant gaps in their assessment of Bitcoin, which affects corporate financing costs and risk pricing in credit markets.
GateNews18m ago
Is Zcash About to Rebound? Bitcoin's Trend May Determine ZEC's Next Price Movement
Zcash (ZEC) is currently priced at $220, facing a critical decision closely linked to Bitcoin. If Bitcoin remains strong, ZEC may rebound, and surpassing $242 could trigger a short squeeze; on the other hand, falling below $208 will intensify selling pressure. The overall trend is affected by Bitcoin, so investors should closely watch its movements.
GateNews40m ago
XRP Price Drops Over 60% from Peak, Bank Stablecoins May Indirectly Drive XRP Demand Growth
On March 23rd, XRP declined 3.74%, trading at $1.39, down 62% from its 2025 high. Analysis suggests that weak market confidence is related to macroeconomic pressures. Despite price pressure, institutional infrastructure continues to expand, indicating that XRP has room to establish itself in the financial system. Future discussions may focus on the gap between price volatility and infrastructure expansion.
GateNews42m ago
Bitcoin Briefly Falls Below $70,000 Mark During Asian Session as Fed Hawkishness and Macro Uncertainty Weigh on Market Volatility
Bitcoin fell below 70,000 on March 19, touching approximately 69,537, reflecting market concerns about the Federal Reserve maintaining high interest rates. Bitcoin subsequently rebounded to around 70,180, demonstrating psychological support at the 70,000 level. Despite improved market fund inflows, cryptocurrencies continue to face challenges amid global macroeconomic pressures, with 70,000 becoming a critical near-term level.
区块客48m ago
