
**Date: **Tue, Jan 06, 2026 | 10:08 AM GMT
The broader cryptocurrency market continues to show fresh strength at the start of the new year. Both Bitcoin (BTC) and Ethereum (ETH) are posting weekly gains of over 6%, helping restore confidence across the market. This improving sentiment is now spilling over into major altcoins — including Jupiter (JUP).
JUP has already delivered an impressive 20% gain on the week. While the short-term momentum is encouraging, the more important development is unfolding on the higher-timeframe chart. Recent price action suggests a meaningful shift in market behavior, hinting that JUP could be transitioning from a corrective phase into a broader bullish continuation if key resistance zones are reclaimed.
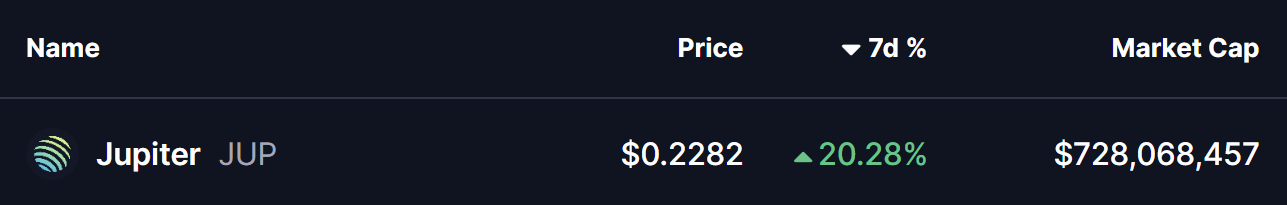
Source: Coinmarketcap
Rounding Bottom Formation Taking Shape
On the daily chart, Jupiter appears to be forming a rounding bottom pattern — a classic bullish reversal structure that typically develops after extended downside pressure and gradual seller exhaustion.
This setup began after JUP faced a strong rejection from the $0.4540–$0.4760 resistance zone in late October. That rejection triggered a sharp sell-off, dragging price lower toward the $0.17 region. However, bears failed to maintain control beyond that point. Selling pressure faded, demand began to absorb supply, and price started stabilizing.
Over time, volatility compressed and JUP began curling higher in a smooth, rounded fashion — closely matching the textbook behavior of a developing rounding bottom. Importantly, the recent recovery has pushed price back above the 50-day moving average around $0.2192, a level that previously capped upside attempts and now appears to be turning into support.
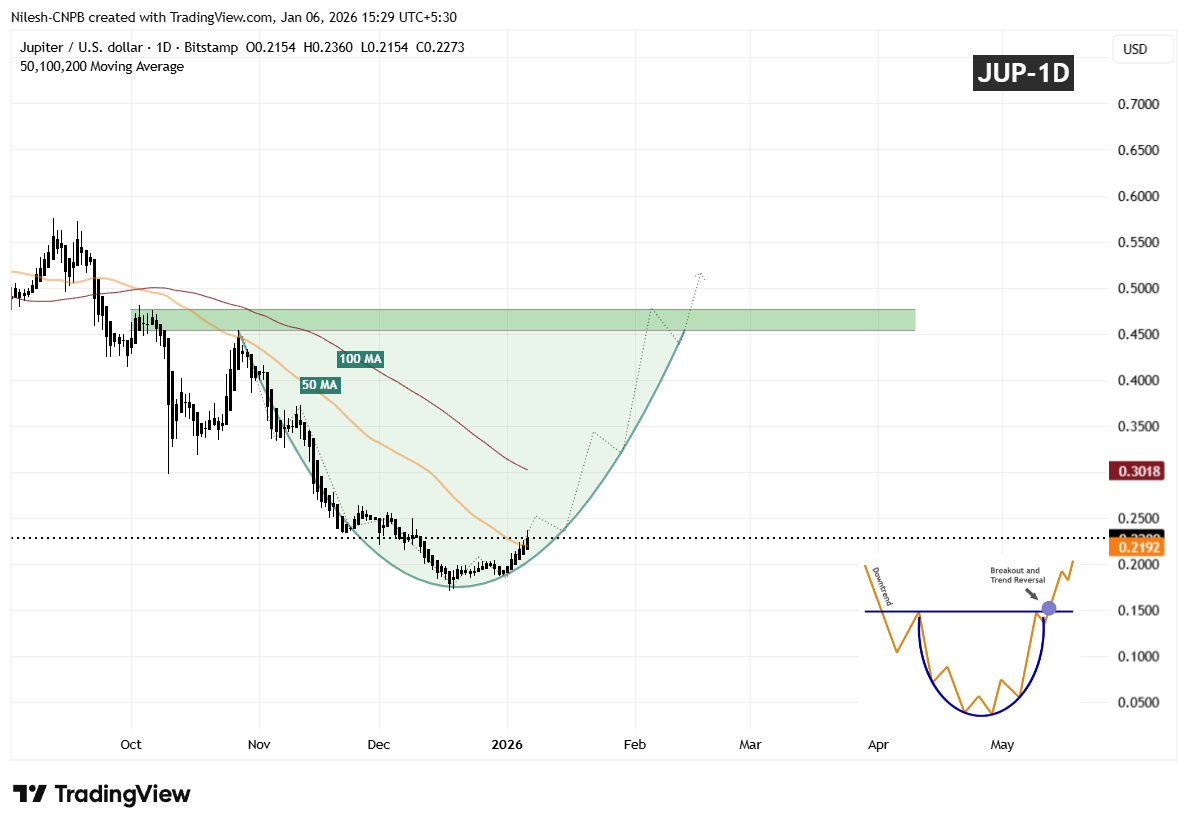
Jupiter (JUP) Daily Chart/Coinsprobe (Source: Tradingview)
The gradual slope of the recovery suggests organic accumulation rather than speculative spikes, reinforcing the credibility of the developing base.
What’s Next for JUP?
If JUP continues to hold above the 50-day moving average, this level could serve as a solid foundation for further upside, with the 100-day moving average acting as the next upside magnet in the near term.
A clean and decisive breakout above the $0.4540–$0.4760 resistance zone, followed by sustained acceptance above that area, would confirm the rounding bottom reversal and likely open the door for a broader bullish expansion phase.
Until that breakout occurs, the pattern remains in development. Some short-term consolidation or shallow pullbacks are possible as price digests recent gains. However, as long as JUP continues to print higher lows above the established base, the broader structure remains constructive.
For now, the chart suggests Jupiter is approaching a critical confirmation phase — one that could determine whether this recovery matures into a sustained bullish trend as 2026 progresses.
Disclaimer: The views and analysis presented in this article are for informational purposes only and reflect the author’s perspective, not financial advice. Technical patterns and indicators discussed are subject to market volatility and may or may not yield the anticipated results. Investors are advised to exercise caution, conduct independent research, and make decisions aligned with their individual risk tolerance.
About Author: Nilesh Hembade is the Founder and Lead Author of Coinsprobe, with over 5 years of experience in the cryptocurrency and blockchain industry. Since launching Coinsprobe in 2023, he has been providing daily, research-driven insights through in-depth market analysis, on-chain data, and technical research.
Disclaimer: The information on this page may come from third parties and does not represent the views or opinions of Gate. The content displayed on this page is for reference only and does not constitute any financial, investment, or legal advice. Gate does not guarantee the accuracy or completeness of the information and shall not be liable for any losses arising from the use of this information. Virtual asset investments carry high risks and are subject to significant price volatility. You may lose all of your invested principal. Please fully understand the relevant risks and make prudent decisions based on your own financial situation and risk tolerance. For details, please refer to
Disclaimer.
Related Articles
Mining 1 Coin Loses $20,000! Bitcoin Miners Flee En Masse, "Mining Difficulty" Plummets 7.8%
Bitcoin mining industry is facing severe challenges as coin prices decline and energy costs rise, with mining costs soaring to $88,000, causing miners to lose nearly $20,000 per bitcoin mined. International oil prices and geopolitical risks intensify financial pressure on miners. Hash rate decline and extended block time indicate miners are exiting the market, driving a sell-off wave that further impacts price structure. To survive, mining companies are turning to AI and high-performance computing to seek new revenue streams.
区块客12m ago
Hyperliquid Fees Surge as HYPE Lags Valuation Growth
Key Insights:
Hyperliquid generated $14 million in weekly fees, reflecting strong derivatives demand and positioning the protocol among the top revenue drivers in decentralized finance.
HyperEVM recorded 55 percent transaction growth and 25% user expansion, highlighting rapid adoption and st
CryptoFrontNews22m ago
XRP Liquidation Data Flashes Bullish Signal
The XRP market shows stagnant price movement at $1.42, but liquidation data indicates strong potential for a price squeeze. With $310 million in short liquidations above and only $112 million in long liquidations below, an upward movement could trigger significant buying pressure, possibly leading XRP to its all-time highs.
CaptainAltcoin42m ago
Oil Prices Stabilize, Supporting Risk Asset Rally! Wintermute: Bitcoin Rebounds Above $70,000 Reflecting Cooling Geopolitical Risk Premium
Cryptocurrency market maker Wintermute points out that Bitcoin's return to the $70,000 level is due to easing tensions in the Middle East, which has led to a decline in crude oil prices and reduced geopolitical risks. Market concerns about inflation and supply disruptions have eased, with capital flowing toward risk assets. If oil prices remain stable, it could improve Bitcoin's performance; if they rise again, it could suppress Bitcoin's price.
区块客1h ago
Bitcoin steadies above $71,000 as oil falls below $100 after U.S. drafts 15‑point Iran peace plan
The essay discusses a 15-point peace plan aimed at resolving the U.S.-Israel-Iran conflict, reflecting positive market responses like a stable Bitcoin price. It also highlights fluctuating oil prices and their potential impact on inflation and financial markets, emphasizing uncertainty about the plan's effectiveness.
CoinDesk1h ago
