
**Date: **Mon, Jan 05, 2026 | 07:55 AM GMT
As 2026 kicks off, the broader cryptocurrency market is showing renewed stability. Ethereum (ETH) is up around 4% on the week, and improving sentiment is gradually spreading across major altcoins — including Ethena (ENA).
ENA has already surged more than 14% on a weekly basis, but the more important development is unfolding beneath the surface. While short-term strength is encouraging, the bigger story lies in the structure forming on the chart. Recent price action suggests a meaningful shift in market behavior — one that could mark the early stages of a bullish continuation if key resistance levels are reclaimed.

Source: Coinmarketcap
Rounding Bottom in Play
On the daily timeframe, ENA appears to be forming a rounding bottom pattern, a classic bullish reversal structure that typically develops after a prolonged corrective phase.
The setup began after ENA faced a firm rejection near the $0.3028–$0.2837 resistance zone late last month. That rejection triggered a sharp decline, dragging price down toward the $0.1935 area. Importantly, sellers failed to push price meaningfully lower from there, and strong demand emerged at those levels. Over time, ENA stabilized, volatility compressed, and price began to curl higher — completing the rounded base structure.
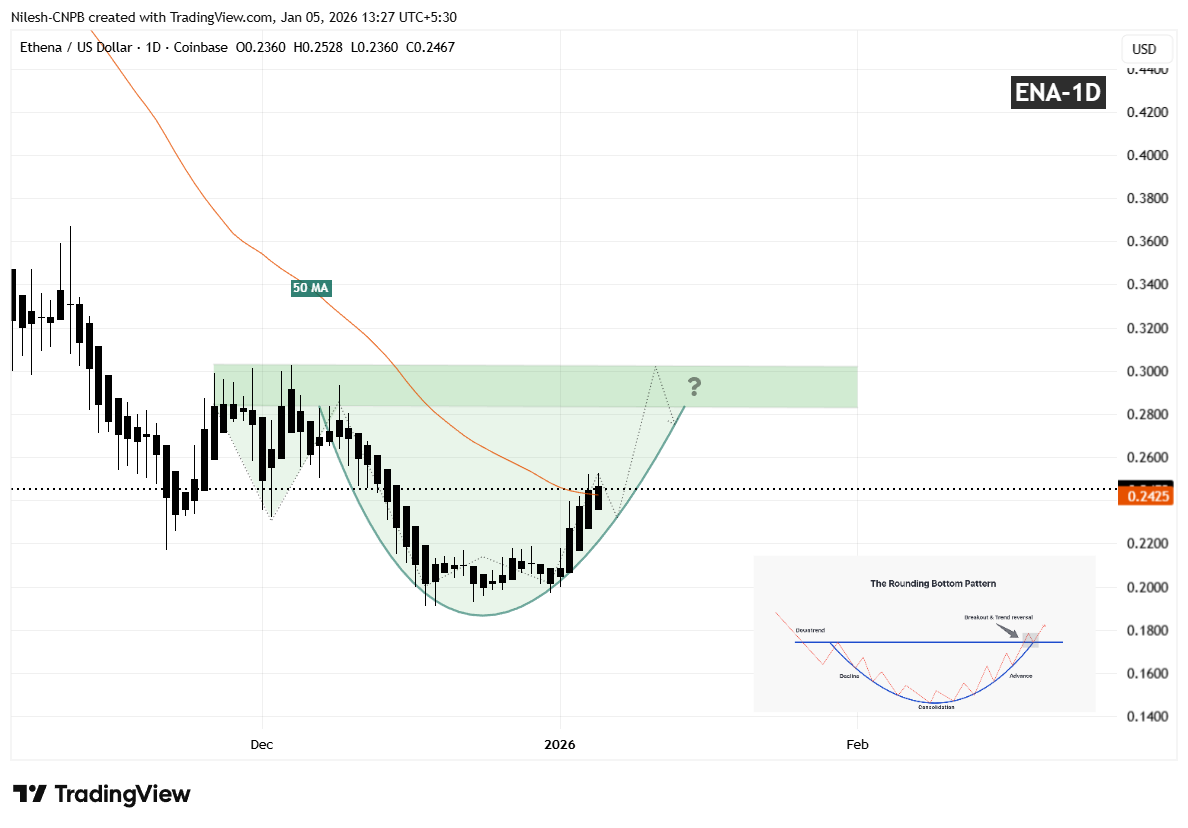
Ethena (ENA) Daily Chart/Coinsprobe (Source: Tradingview)
Since carving out that bottom, ENA has started to move higher in a smooth, rounded fashion, closely matching the textbook characteristics of a developing rounding bottom. The recent recovery has also brought price back toward the 50-day moving average near $0.2451, a level that previously acted as resistance and is now being tested as potential support.
What’s Next for ENA?
If ENA continues to hold above the 50-day MA, that level could act as a solid short-term base for further upside attempts. A clean and decisive breakout above the $0.3028–$0.2837 resistance zone, followed by sustained acceptance above it, would validate the entire reversal pattern and likely open the door for a broader bullish expansion phase.
Until such a breakout occurs, the pattern remains in development. Short-term consolidation or shallow pullbacks remain possible as price digests recent gains. However, as long as ENA continues to form higher lows above the established base, the broader bottoming structure remains intact and constructive.
For now, the chart suggests ENA is approaching a critical confirmation phase — one that could determine whether this recovery evolves into a sustained bullish trend as the new year unfolds.
Disclaimer: The views and analysis presented in this article are for informational purposes only and reflect the author’s perspective, not financial advice. Technical patterns and indicators discussed are subject to market volatility and may or may not yield the anticipated results. Investors are advised to exercise caution, conduct independent research, and make decisions aligned with their individual risk tolerance.
About Author: Nilesh Hembade is the Founder and Lead Author of Coinsprobe, with over 5 years of experience in the cryptocurrency and blockchain industry. Since launching Coinsprobe in 2023, he has been providing daily, research-driven insights through in-depth market analysis, on-chain data, and technical research.
Disclaimer: The information on this page may come from third parties and does not represent the views or opinions of Gate. The content displayed on this page is for reference only and does not constitute any financial, investment, or legal advice. Gate does not guarantee the accuracy or completeness of the information and shall not be liable for any losses arising from the use of this information. Virtual asset investments carry high risks and are subject to significant price volatility. You may lose all of your invested principal. Please fully understand the relevant risks and make prudent decisions based on your own financial situation and risk tolerance. For details, please refer to
Disclaimer.
Related Articles
The RWA Yield Infrastructure Trade
What to know:
Direct RWA token exposure doesn't work. The economic value from tokenization accrues to curators and issuers, not governance tokenholders - Kamino's 80% deposit growth alongside a 16% token decline is the cleanest proof of this.
The leverage problem is the most interesting
CoinDesk8m ago
XRP is under selling pressure during the market-wide correction: What's next?
Ripple (XRP) is increasing selling pressure as it slips below the important threshold of $1.40, trading around $1.37 at the time of recording on Friday. This development extends the correction since the weekly peak of $1.61 established on March 17, reflecting a clear weakening trend. At the same time, XRP also cannot hold its position.
TapChiBitcoin8m ago
Ethereum Caught Between Long and Short Squeeze Zones as Liquidation Risks Build
_Ethereum trades between liquidation zones, with leverage driving risk of sharp moves above $2,200 or below $2,050._
Ethereum’s recent price swing reflects a fast-moving liquidation cycle in a market crowded with highly margined positions. As ETH slipped through dense liquidity bands, forced sell o
LiveBTCNews12m ago
Gold plummets, "safe haven for funds" changes hands? JPMorgan: During war, "Bitcoin becomes the new favorite for hedging."
JPMorgan pointed out that in the Middle East conflict, Bitcoin has demonstrated strong resilience against declines, with a significant inflow of funds and active trading, while gold and silver are facing capital outflows. Under the pressure of high interest rates and a strong dollar, gold prices have fallen by about 15%. With its borderless characteristics, Bitcoin has become a safe-haven choice, and institutional investors are also adjusting their positions, indicating a decrease in gold liquidity and an increase in Bitcoin liquidity.
区块客13m ago
XRP Today News: Leverage Ratio Drops 78% Sharply, On-Chain Transaction Volume Hits a New Annual High
XRP derivatives market leverage drops to its lowest level in nearly nine months, indicating that the market overheating pressure is easing. At the same time, XRPL’s weekly transaction volume reaches 19 million, driven by Ripple’s business progress and new partnerships. However, the technical risk XRP faces lies in its head-and-shoulders top pattern; the key support level is between $1.37 and $1.40, and a break below could lead to a pullback.
MarketWhisper1h ago
