
Date: Fri, Jan 02, 2026 | 09:15 AM GMT
The broader cryptocurrency market has started the new year on a stable footing, with both Bitcoin (BTC) and Ethereum (ETH) trading slightly higher and posting gains of over 1.5%. This modest strength across major assets has provided breathing room for risk-on sentiment, allowing several memecoins to show early signs of recovery — including Popcat (SOL) (POPCAT).
POPCAT is currently trading by solid 19% higher on the day, but the more important development lies in its broader technical structure. After months of consistent downside pressure, the price action is now beginning to hint at a potential trend reversal, supported by a well-defined bullish pattern forming on the daily chart.
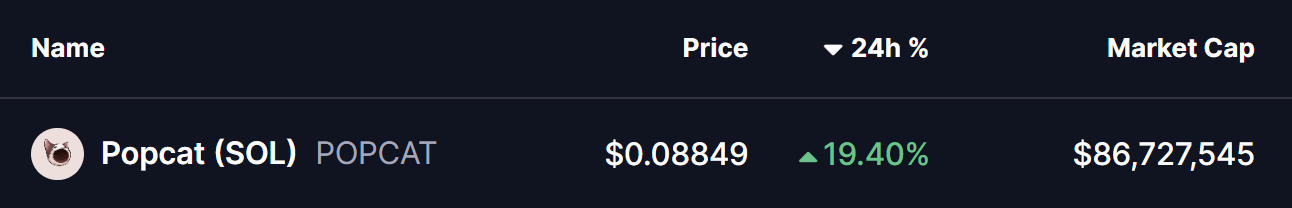
Source: Coinmarketcap
Falling Wedge Pattern in Play
On the daily timeframe, POPCAT appears to be carving out a falling wedge formation — a classic bullish reversal pattern that often develops after extended downtrends. This structure is characterized by lower highs and lower lows that gradually converge, reflecting weakening selling pressure and growing buyer interest near the lows.
Following weeks of steady decline, POPCAT recently established a local bottom near the $0.0725 region. This area acted as a strong demand zone, where buyers stepped in aggressively and prevented further downside. The resulting rebound pushed price back toward the $0.088 level, placing POPCAT just beneath the wedge’s upper resistance trendline.
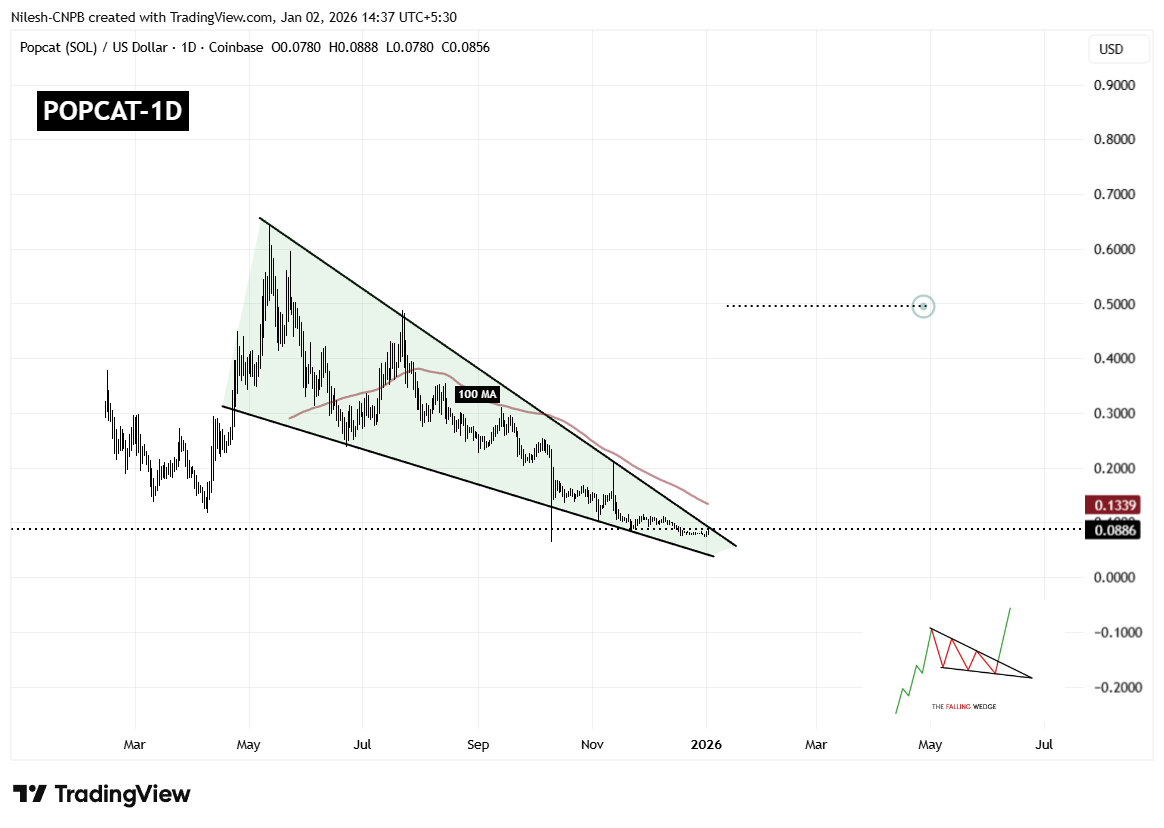
Popcat (POPCAT) Daily Chart/Coinsprobe (Source: Tradingview)
This compression near resistance is technically significant, as falling wedges tend to resolve with a sharp upside move once price breaks out of the structure. The longer price coils within the wedge, the stronger the eventual breakout tends to be.
However, overhead resistance remains notable. The 100-day moving average, currently hovering around $0.1339, represents a major technical barrier. This level has previously acted as dynamic resistance and will likely be a key area to watch if a breakout occurs.
What’s Next for POPCAT?
If buyers manage to push price decisively above the wedge resistance and reclaim the 100-day moving average with a strong daily close, POPCAT could confirm a bullish breakout. Such a move would mark a clear shift in trend structure and could open the door for a larger recovery rally.
Based on the measured move of the falling wedge pattern, the upside projection points toward the $0.49 region. Reaching this level would represent a substantial recovery from current prices and could attract renewed interest from momentum traders and sidelined participants.
That said, failure to break above resistance could result in continued consolidation. In a bearish scenario, POPCAT may revisit the $0.072 support zone once again. As long as this level continues to hold, the broader falling wedge structure would remain intact, keeping the bullish reversal thesis alive.
Overall, POPCAT is approaching a technically critical juncture. With price tightly compressed, selling pressure fading, and buyers defending key support levels, the coming sessions could prove decisive in determining whether this memecoin is ready to stage its next meaningful move higher.
Disclaimer: The views and analysis presented in this article are for informational purposes only and reflect the author’s perspective, not financial advice. Technical patterns and indicators discussed are subject to market volatility and may or may not yield the anticipated results. Investors are advised to exercise caution, conduct independent research, and make decisions aligned with their individual risk tolerance.
About Author: Nilesh Hembade is the Founder and Lead Author of Coinsprobe, with over 5 years of experience in the cryptocurrency and blockchain industry. Since launching Coinsprobe in 2023, he has been providing daily, research-driven insights through in-depth market analysis, on-chain data, and technical research.

Disclaimer: The information on this page may come from third parties and does not represent the views or opinions of Gate. The content displayed on this page is for reference only and does not constitute any financial, investment, or legal advice. Gate does not guarantee the accuracy or completeness of the information and shall not be liable for any losses arising from the use of this information. Virtual asset investments carry high risks and are subject to significant price volatility. You may lose all of your invested principal. Please fully understand the relevant risks and make prudent decisions based on your own financial situation and risk tolerance. For details, please refer to
Disclaimer.
Related Articles
BNB Chain leads the AI sector with 39.9% market share, so why is the price still falling?
BNB Chain is emerging as a leader in the AI agent ecosystem, holding 39.9% market share. However, its token BNB's price has not reflected this growth, remaining 25.9% below its previous peak, as market sentiment remains cautious.
TapChiBitcoin7m ago
The Number of XRP Wallets Just Broke Another Record – Here’s What the Distribution Looks Like
XRP just crossed a milestone that doesn’t show up on the price charts. The number of wallets holding less than 100 XRP hit an all‑time high, pushing total addresses on the ledger to new levels.
Even though traders stare at the $1.45 price level and wonder where the next move comes from, the ne
CaptainAltcoin10m ago
Bitcoin Holds Strong at $70,000! On-Chain Data Reveals "Collective Selling Wave," Retail Investors Emerge as Biggest Selling Pressure
Under Middle East geopolitical tensions, Bitcoin faced widespread selling pressure, particularly from retail holders. According to Glassnode data, the market is experiencing heavy selling pressure, with the accumulated trend score declining to 0.04, indicating that retail and small-to-medium investors are reducing their positions significantly. Despite this, Bitcoin's resilience against the decline has surprised market observers.
区块客1h ago
Dogecoin Slides Despite Elon Musk Reviving DogeFather Persona
Key Insights
Elon Musk’s DogeFather post sparked attention, yet Dogecoin’s price declined, showing limited market reaction despite strong social media engagement and renewed community discussion.
Dogecoin traded near $0.093 after a failed recovery attempt, with steady volume and moderate
CryptoFrontNews1h ago
Bittensor Holds Strength but Faces Resistance Near $285 Level
Key Insights:
Bittensor maintains strong short-term momentum above key averages, while ETF developments and high staking levels continue shaping liquidity and investor demand dynamics.
Overbought technical indicators signal stretched conditions, even as bullish momentum persists,
CryptoFrontNews1h ago
Hyperliquid Price Jumps 22% as Commodity Trading Hits Record
Key Insights:
Hyperliquid surged over 20% weekly, driven by record commodity futures trading volumes, especially oil and silver contracts, gaining strong traction among traders.
Whale activity surpassed $3.6 billion in leveraged positions, boosting liquidity and reinforcing upward momentum a
CryptoFrontNews1h ago
