
Date: Thu, Jan 01, 2026 | 10:30 AM GMT
As the new year 2026 begins, the broader cryptocurrency market is showing modest weakness, with both Bitcoin (BTC) and Ethereum (ETH) trading slightly in the red. This soft start has weighed on sentiment across the altcoin space as well, including Monad (MON). However, beneath the surface, MON’s chart structure is beginning to tell a more constructive story.
MON is currently down around 4% on the day, extending its 60-day decline to roughly 21%. While short-term price action remains subdued, the more important signal is emerging on the daily chart, where price structure is beginning to hint at a meaningful shift. If confirmed, this setup could mark the early stages of a bullish continuation following a prolonged corrective phase.
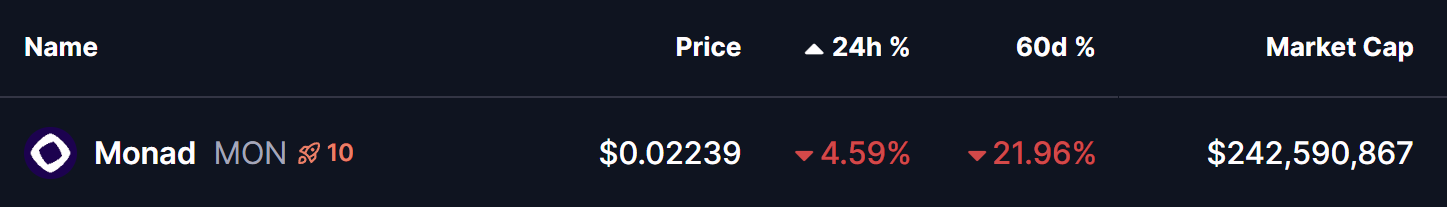
Source: Coinmarketcap
Rounding Bottom in Play
On the daily timeframe, MON appears to be forming a textbook rounding bottom pattern — a classic bullish reversal structure that typically develops after extended downside pressure. This pattern reflects a gradual transition from distribution to accumulation, where selling momentum weakens and buyers begin to step in more consistently.
Previously, MON faced strong rejection near the $0.04923 neckline zone, triggering a sharp decline that unfolded through late November and December. That move eventually found a floor near the $0.017 level, which has since acted as a key demand zone. Repeated defenses of this area prevented any deeper breakdown and helped establish a stable base for a potential trend reversal.
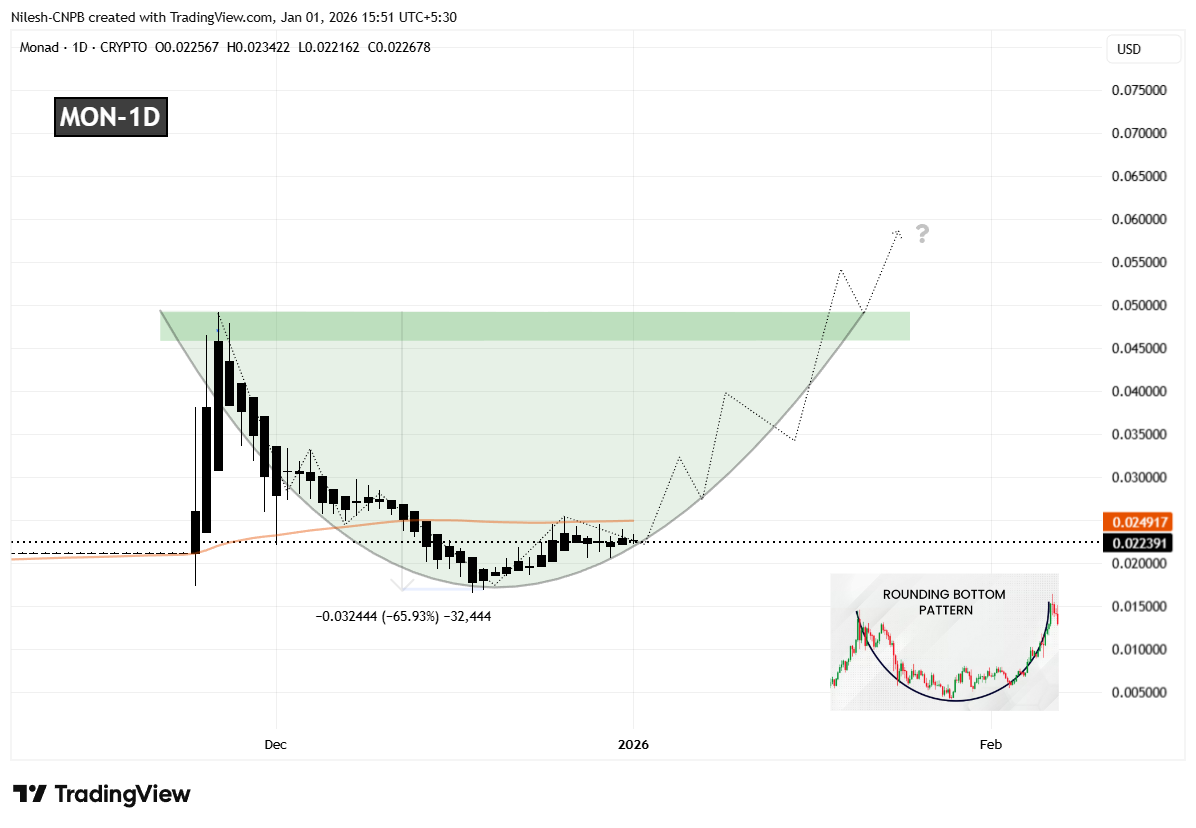
Monad (MON) Daily Chart/Coinsprobe (Source: Tradingview)
Since forming that bottom, MON has started to curve higher in a rounded fashion, closely matching the classic structure of a developing bottoming pattern. This gradual recovery suggests that selling pressure is fading rather than accelerating. The recent stabilization and recovery back above the $0.022 region further indicate that accumulation may be taking place as the market quietly prepares for a larger move.
What’s Next for MON?
For the rounding bottom pattern to move into confirmation, MON needs to reclaim the 50-day moving average, currently positioned near the $0.02491 level. A sustained move above this area would signal a shift in short-term momentum and confirm that buyers are beginning to regain control after months of corrective price action.
Looking ahead, the most significant technical hurdle remains the neckline resistance around $0.04923. A clean and decisive breakout above this zone would validate the entire reversal structure and could open the door for a broader bullish expansion phase, with momentum traders likely returning to the market.
Until those levels are reclaimed, the pattern remains in its early development stage. Short-term pullbacks or consolidation remain possible if MON struggles near the 50-day moving average. However, as long as price continues to hold higher lows above the $0.017 base, the broader bottoming structure remains intact.
Overall, MON’s emerging rounding bottom formation suggests the token may be approaching an important inflection point. While confirmation is still pending, the improving structure and alignment with a classic bullish pattern indicate that the coming sessions could be decisive for Monad’s next directional move.
Disclaimer: The views and analysis presented in this article are for informational purposes only and reflect the author’s perspective, not financial advice. Technical patterns and indicators discussed are subject to market volatility and may or may not yield the anticipated results. Investors are advised to exercise caution, conduct independent research, and make decisions aligned with their individual risk tolerance.
About Author: Nilesh Hembade is the Founder and Lead Author of Coinsprobe, with over 5 years of experience in the cryptocurrency and blockchain industry. Since launching Coinsprobe in 2023, he has been providing daily, research-driven insights through in-depth market analysis, on-chain data, and technical research.

Disclaimer: The information on this page may come from third parties and does not represent the views or opinions of Gate. The content displayed on this page is for reference only and does not constitute any financial, investment, or legal advice. Gate does not guarantee the accuracy or completeness of the information and shall not be liable for any losses arising from the use of this information. Virtual asset investments carry high risks and are subject to significant price volatility. You may lose all of your invested principal. Please fully understand the relevant risks and make prudent decisions based on your own financial situation and risk tolerance. For details, please refer to
Disclaimer.
Related Articles
Bitcoin Nears a Fragile Bottom As CryptoQuant Warns of Bull Traps
Bitcoin (BTC) is entering another tense stretch, with CryptoQuant warning that the market’s supply-demand imbalance has sharpened in recent weeks and now looks less like a clean reset and more like the kind of messy deterioration that can trap late buyers. In its latest note, the analytics firm
BlockChainReporter17m ago
Did Donald Trump Just Kill Crypto Innovation? Here’s What Happened With Stablecoin Yield
The crypto market is reacting strongly to new political news, and this time it’s about stablecoin yield. Many traders believe a new draft of the U.S. Clarity Act could seriously limit how stablecoins generate returns, and that has already started to affect the market.
One of the biggest reacti
CaptainAltcoin21m ago
FTX Bankruptcy Liquidation's Unexpected Creation of a "Hedge Fund Harvesting Manual": Why Altcoins Lost to Bitcoin in Nearly Every Way from 2023-2025
FTX's bankruptcy liquidation created a new type of asset trading, where hedge funds achieve stable high returns by purchasing locked tokens at a discount and shorting them in the futures market, while retail investors become liquidity providers, leading to poor cryptocurrency market performance from 2023-2025. Bitcoin benefits from structural advantages due to its transparent supply and absence of locked tokens.
ChainNewsAbmedia27m ago
ETH SuperTrend Turns Green but $2,400 Stays Unbroken
_Ethereum’s daily SuperTrend flipped bullish for the first time since May 2024, but $2,400 resistance keeps blocking any real breakout attempt. Is ETH ready?_
Ethereum ran into a wall. Again. After weeks of grinding between $1,750 and $2,150, ETH finally broke above the range ceiling, pushed into t
LiveBTCNews31m ago
Why XRP Price Risks Further Decline Despite Recovery Signs
Recent XRP price action shows a market that looks steady on the surface but still carries underlying pressure. XRP currently trades around $1.43, up about +0.70% over the past 24 hours and roughly +2.33% across 30 days, yet it remains down about 3.97% over the past week.
That mixed
CaptainAltcoin51m ago
