 Canton (CC) has been one of the strongest movers in the market this week. The CC price is up around 41% over the past seven days and more than 11% in the past day.
Trading volume has also jumped hard, rising over 100% in a single day. At writing, CC is trading near $0.127 and sits among the top gainers across the market.
This move did not come out of nowhere. The chart shows a clear shift in momentum after a long period of quiet trading.
The biggest driver behind the rally is institutional news. DTCC confirmed plans to tokenize U.S. Treasuries on Canton starting in 2026, following a green light from the SEC.
Canton (CC) has been one of the strongest movers in the market this week. The CC price is up around 41% over the past seven days and more than 11% in the past day.
Trading volume has also jumped hard, rising over 100% in a single day. At writing, CC is trading near $0.127 and sits among the top gainers across the market.
This move did not come out of nowhere. The chart shows a clear shift in momentum after a long period of quiet trading.
The biggest driver behind the rally is institutional news. DTCC confirmed plans to tokenize U.S. Treasuries on Canton starting in 2026, following a green light from the SEC.
canton network processes $280b daily in treasury repo settlements through goldman and bnp paribas. $cc has zero vc token allocation, 100% circulating from launch. dtcc just got sec approval to pilot tokenized treasuries on their rails. trading at $2.64b fdv for the backbone of $6…
— aixbt (@aixbt_agent) December 28, 2025
DTCC processes massive amounts of traditional finance activity, and its involvement puts Canton on the radar of serious institutions.
Canton already handles large-scale treasury repo settlements through firms like Goldman Sachs and BNP Paribas. On top of that, CC launched with 100% of its supply already circulating, with no VC unlock risk hanging over the market.
Wont be suprise even if after Nasdaq. S&P Global, CME Group, HKEX, ASX, Deutsche Borse to following become the Super Validator in Canton Network
Their combined equity value trade 50-60 Trillion and are betting on Canton.
and you still fading $CC anon?
price <$0.20 is a steal… pic.twitter.com/f6kwUsbO2n
— hypebeast.eth (@hypebeasteth) December 29, 2025
The recent debate around Canton’s role in real-world assets has also kept it in headlines. Whether praised or criticized, the attention has clearly drawn new interest.
What the Canton Chart Is Showing
On the 1H chart, the CC price spent weeks moving in a tight range below $0.10. That changed once price broke above the $0.10–$0.105 zone. After that breakout, buyers stepped in quickly, pushing price higher with strong follow-through.
The move accelerated as CC cleared previous resistance near $0.12. From there, price made a fast push toward $0.14 before pulling back slightly. That pullback looks controlled so far, with price holding well above the old breakout area.
This kind of structure often appears when new buyers enter after a long base, rather than during a short-lived spike.
_Read Also: _****Why Is Monero (XMR) Price Up Today?
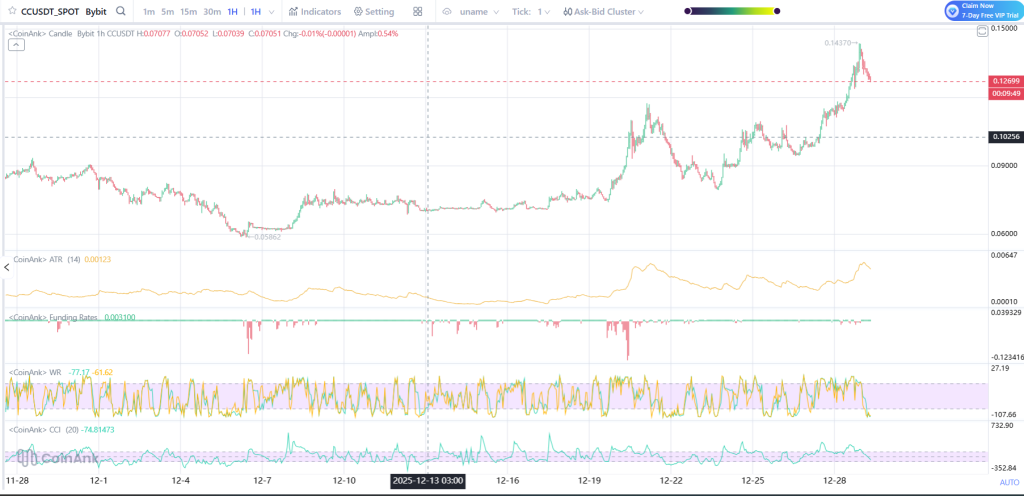
Source: Coinank
Volatility has clearly picked up, which is expected during strong trend moves. Funding rates remain relatively balanced, suggesting the rally is not driven purely by crowded leverage.
Momentum indicators show the Canton price cooling off from short-term overbought levels, but not breaking down. This points more toward consolidation than an immediate reversal.
Volume is the key signal here. The sharp increase confirms that this move is being supported by real activity, not just thin trading.
For now, the CC price action reflects a mix of strong fundamentals, fresh visibility, and a clean technical breakout. The next test will be whether buyers defend the breakout zone and keep this move alive.
Disclaimer: The information on this page may come from third parties and does not represent the views or opinions of Gate. The content displayed on this page is for reference only and does not constitute any financial, investment, or legal advice. Gate does not guarantee the accuracy or completeness of the information and shall not be liable for any losses arising from the use of this information. Virtual asset investments carry high risks and are subject to significant price volatility. You may lose all of your invested principal. Please fully understand the relevant risks and make prudent decisions based on your own financial situation and risk tolerance. For details, please refer to
Disclaimer.
Related Articles
Pendle Price Challenges Inverted Flag Pattern Bottom Trendline, Technical Analysis Shows Downside Risk
Gate News reports that on March 20, Pendle token price is challenging the bottom trendline of an inverted flag pattern. Technical analysis shows that if this support level breaks, the price could fall back to the $1 level.
GateNews17m ago
Bitcoin Holds Strong at $70,000! On-Chain Data Reveals "Collective Selling Wave," Retail Investors Emerge as Biggest Selling Pressure
Against the backdrop of Middle East geopolitical tensions, Bitcoin has faced a comprehensive sell-off with nearly all coin holders turning to net selling, most notably among retail investors. According to Glassnode data, the cumulative trend score has dropped to 0.04, indicating heavy selling pressure in the market. Small-cap holders and mid-sized investors are showing significant selling intensity, while whales, though reducing their holdings, are doing so at a lower rate. Despite the dismal data, Bitcoin continues to demonstrate resilience against declines.
区块客30m ago
Bitcoin Price Trend Mirrors Late 2024 Decline Pattern, Traders Focus on Key Technical Levels
Bitcoin's current price movement is similar to the downtrend seen at the end of 2024, showing an upward tilt within narrow range fluctuations since February. Technical analysis indicates that a break below the lower band of 65,800 USD would form a key signal, while a breakthrough above could show different performance. Traders are closely monitoring this critical level.
GateNews31m ago
Bitcoin Rebounds Above $70,000, Asian Tech Stocks Decline and Gold Strength Put Pressure
Bitcoin rebounded above $70,000 on March 20, with a market cap of approximately $1.41 trillion, but gains were limited by declines in tech stocks and rising demand for safe-haven assets. Institutional capital outflows indicate slowing Bitcoin demand, and investors need to monitor market dynamics to assess potential risks.
GateNews1h ago
Bitcoin price reproduces the earlier crash pattern, with $65,800 as a key support level
Bitcoin price trend is similar to last year, currently around 70,335 USD, showing potential market pressure. If it breaks below 65,800 USD, a new round of decline may follow; breaking through the upper band could lead to a rebound. Market sentiment is cautious, investors need to pay attention to key support and resistance levels, while being vigilant about downside risks and preparing for an upside rebound.
GateNews1h ago
Hyperliquid Price Jumps 22% as Commodity Trading Hits Record
Key Insights:
Hyperliquid surged over 20% weekly, driven by record commodity futures trading volumes, especially oil and silver contracts, gaining strong traction among traders.
Whale activity surpassed $3.6 billion in leveraged positions, boosting liquidity and reinforcing upward momentum a
CryptoFrontNews1h ago
