- Ethena (ENA) is holding near $0.24.
- It displays a TD Sequential buy signal.
The active bearish wind within the crypto market has triggered most of the assets down, losing momentum. As the Fear and Greed Index value holds at 12, the market sentiment lingers at extreme fear. Bitcoin has slipped toward $85K, while Ethereum trades at $2.8K. However, Ethena (ENA) has registered a spike of over 1.5%.
In the morning hours, the asset traded at a low of $0.2344. After the brief bullish wave, the ENA price rose toward $0.2487, breaking crucial resistances between $0.2348 and $0.2483 zones. Currently, Ethena trades at $0.2426, with its market cap at $1.8 billion. ENA’s daily trading volume has reached $157.47 million
Moreover, the Ali chart exhibits that Ethena is in a clear downtrend with a recent TD Sequential buy signal appearing on the last candle. The appearance of a buy signal suggests the downtrend might be nearing its end, which is likely interpreted as a potential short-term reversal.
Can Ethena Break Free From the Red Zone This Week?
ENA’s Moving Average Convergence Divergence and the signal lines sit below the zero line, implying the overall bearish phase. The momentum is weak, and even if the MACD crosses above the signal line, an early bullish momentum is shown, not a confirmed reversal. Notably, the Chaikin Money Flow (CMF) indicator settled at -0.01, hinting at a slight selling pressure in the Ethena market. The capital flow is leaning bearish, but not enough to confirm a strong distribution.
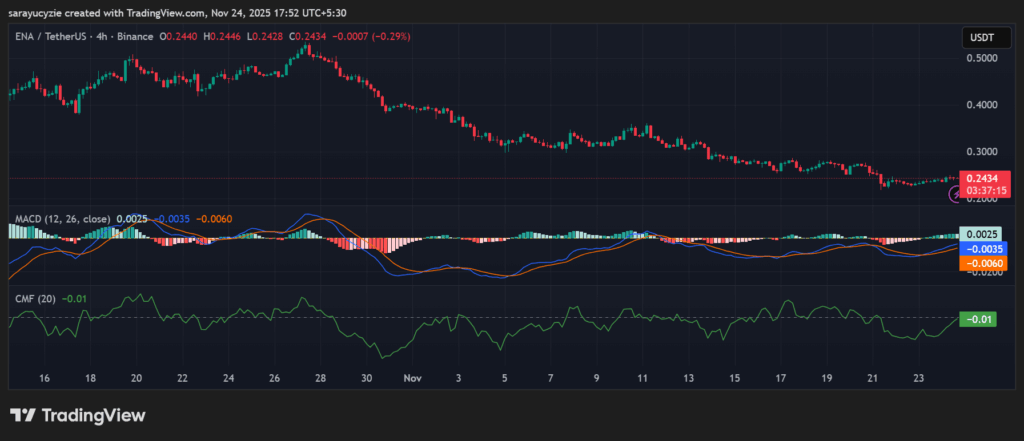 *ENA chart (Source: TradingView)*Besides, the asset’s Bull Bear Power (BBP) value of 0.0056 indicates mild bullish momentum, but not strongly. As it is close to zero, the strength behind the move is weak, and the market is trying to shift upward, but has not built solid bullish momentum. The current market sentiment of ENA is neutral, with the daily Relative Strength Index (RSI) settled at 49.62. It likely suggests consolidation and needs a strong push from either bulls or bears
The downside correction of Ethena might push the price to its crucial support at the $0.2419 range. Assuming the formation of a death cross, a continued downward push could happen, leading the asset’s price to fall toward $0.2412. On a bullish reversal, Ethena’s nearby resistance range could be found at around $0.2433. Holding this level might invite the emergence of the golden cross, and gradually open the doors for further gains above the $0.2440 mark.
Top Updated Crypto News
Big Test for Hedera (HBAR): How High Can It Climb Before the Bulls Slow Down?
Disclaimer: The information on this page may come from third parties and does not represent the views or opinions of Gate. The content displayed on this page is for reference only and does not constitute any financial, investment, or legal advice. Gate does not guarantee the accuracy or completeness of the information and shall not be liable for any losses arising from the use of this information. Virtual asset investments carry high risks and are subject to significant price volatility. You may lose all of your invested principal. Please fully understand the relevant risks and make prudent decisions based on your own financial situation and risk tolerance. For details, please refer to
Disclaimer.
Related Articles
Bitcoin risks 50% drop as BTC’s positive correlation with US stocks grows
Bitcoin (BTC) erased much of its US-Iran war-driven gains this week, moving back in sync with the broader downtrend in risk assets, mainly US equities.
Key takeaways:
Bitcoin’s positive flip in S&P 500 correlation has historically preceded average declines of around 50% since 2018.
BTC
Cointelegraph46m ago
Impact of the Current US–Israel–Iran War on Cryptocurrency: Market Volatility, Bitcoin Trends & Future Outlook (2026)
🌍 Introduction
The ongoing geopolitical conflict involving the United States, Israel, and Iran has created shockwaves across global financial markets. From rising oil prices to falling stock indices, every asset class is being affected — including cryptocurrency.
In 2026, crypto is no
Cryptoknowmics51m ago
BTC Price Fluctuation Analysis
# BTC 2026-03-23 11:00–11:15(UTC)Price Anomaly Deep Attribution Report
## I. Executive Summary and Core Conclusions
During the time window of 2026-03-23 11:00–11:15(UTC), BTC price return was +3.51%, showing significant anomaly. This report systematically traces the causes of price anomaly through quantitative indicators including on-chain data, trading volume, position changes, and capital flows, combined with market structure and behavioral analysis. Conclusions show that this round of anomaly was primarily driven by institutional capital inflows (ETF net purchases), futures market leverage
GateNews1h ago
Crypto Market Declines As Fear Grips Investors
The crypto market is down, with a total market cap of $2.36T. Bitcoin and Ethereum have dipped by 0.82% and 2.47%, respectively. Nonetheless, some altcoins have surged significantly. DeFi TVL has decreased, while NFT sales volume has increased. Blockchain social apps are gaining traction amid geopolitical tensions.
BlockChainReporter1h ago
Solana Price Under Pressure, Can Institutional Buying Support Help SOL Return to $100?
Solana (SOL) has recently hovered around $86-87, declining nearly 7% over the past week, related to overall crypto market weakness. Clear classification of crypto assets by U.S. regulators benefits institutional investors. Capital flows show robust institutional demand, with continuous net inflows into Solana ETFs. Technical analysis shows SOL below the $90 resistance level, with support at $85. Investors should monitor institutional dynamics and technical indicators to gauge short-term trends.
GateNews1h ago
