NiaGood

vip
Age 0 Yıl
Peak Tier 0
No content yet
Stablecoin is essentially a cryptocurrency pegged to fiat currency (mainly the US dollar), aiming to maintain a stable value of approximately 1 coin ≈ 1 USD, serving as a "safe haven" and "transaction medium" in the crypto world.
1. How does it stay "stable"?
Primarily relies on backing collateral or mechanisms, divided into three categories:
Fiat-collateralized (mainstream): such as USDT, USDC. The issuer deposits an equivalent amount of USD or US Treasuries in a bank as reserves. This is currently the most mainstream and liquid form.
Crypto-collateralized: such as DAI. Users deposit over-col
USDC-0,01%
DAI-0,01%
ETH0,44%
LUNA1,09%
View Original
  • Reward
  • Comment
  • Repost
  • Share
#Gate广场四月发帖挑战
On-chain indicators cannot predict specific price points, but they can send clear "resonance signals" at the bottom area. Looking back at the last three bear markets, the patterns are clear:
In the 2018 deep bear market, BTC dropped to $3,200, MVRV fell below 0.7, and market valuation entered the "bankruptcy zone"; at the same time, SOPR (Realized Profit and Loss Ratio) briefly dropped to 0.86, indicating an average on-chain trading loss of 14%, a classic "panic capitulation" signal. Meanwhile, the supply from long-term holders did not decrease, indicating that "believers" were
BTC0,46%
View Original
  • Reward
  • Comment
  • Repost
  • Share
For ordinary investors, grasping the Bitcoin bottom doesn't need to be overly complicated—just focus on three core dimensions:
1. Valuation with MVRV: When the ratio drops below 1, it indicates the overall market has entered a loss zone, entering a historic "discount area." If it falls near 0.8, it signals a deep-water zone.
2. Sentiment with STH-SOPR: It acts like a "fear thermometer" for the market. When the indicator remains below 1, it shows short-term traders are panic-selling, often corresponding to the extreme of "capitulation selling."
3. Supply with LTH Supply: This is key to confirmi
BTC0,46%
View Original
  • Reward
  • Comment
  • Repost
  • Share
#Gate广场四月发帖挑战 Besides whale handovers, determining whether BTC has entered a bottom zone mainly depends on whether the “market is already extremely distressed” and “selling pressure has dried up.” It is recommended to focus on the following four on-chain indicators:
1. Profit and Loss Status Indicators (Assess Valuation and Sentiment)
This is the most direct measure of whether the “market is cheap.”
MVRV Ratio (Market Value / Realized Market Value)
Bottom signal: When MVRV < 1, it indicates that the current market price is below the network’s average cost basis, and the market is generally in
BTC0,46%
View Original
  • Reward
  • Comment
  • Repost
  • Share
#Gate广场四月发帖挑战
In addition to whale handovers, determining whether BTC has entered a bottom zone mainly depends on whether the “market is already extremely distressed” and “selling pressure has been exhausted.” It is recommended to focus on the following four on-chain indicators:
1. Profit and Loss Status Indicators (Assess Valuation and Sentiment)
This is the most direct measure of whether the “market is cheap.”
MVRV Ratio (Market Value / Realized Market Value)
Bottom signal: When MVRV < 1, it indicates that the current market price is below the average cost basis of the entire netw
BTC0,46%
View Original
  • Reward
  • Comment
  • Repost
  • Share
Based on current on-chain data and macro environment, BTC has indeed entered the "bottoming" phase of the latter half of the bear market. However, whether the "worst-case scenario" is over depends on how you define "bad." From the perspective of panic selling during a price plunge, the worst is near; but from the long-term sideways consolidation and capital time cost, the suffering may still be ahead.
Regarding your two core questions, here is a detailed analysis:
1. Is the worst-case scenario nearing its end?
Conclusion: Price discovery is approaching the end, but emotional recovery and capit
BTC0,46%
View Original
  • Reward
  • Comment
  • Repost
  • Share
#Gate广场四月发帖挑战 The price logic of Bitcoin in 2026 is actually quite clear: it’s more like a high-volatility “tech growth stock” rather than a pure safe-haven asset. Its price is determined by three main pillars: “macro liquidity,” “supply and demand structure,” and “regulatory sentiment.”
1. Macro Perspective: The “Barometer” of Liquidity (Short-term Core)
This is the most direct driver behind recent price fluctuations (such as dropping below $69,000). Bitcoin has a very high correlation with U.S. stocks (especially the Nasdaq) and is extremely sensitive to U.S. dollar interest rates.
Federal R
BTC0,46%
View Original
post-image
post-image
  • Reward
  • Comment
  • Repost
  • Share
#Gate广场四月发帖挑战 The Federal Reserve's decision this time (maintaining interest rates at 3.50%–3.75% and signaling a "higher for longer" hawkish stance) is a typical bearish "valuation kill" for the crypto market. Currently, crypto assets are viewed by the market as high-risk assets rather than safe havens, and their movements are highly correlated with the Nasdaq.
1. Short-term impact: liquidity tightening, risk appetite cooling
Cost of capital logic: High interest rates mean high borrowing costs, leading leveraged funds (especially US stock ETFs and institutional capital) to withdraw or reduce
BTC0,46%
ETH0,44%
View Original
post-image
[The user has shared his/her trading data. Go to the App to view more.]
  • Reward
  • Comment
  • Repost
  • Share
#Gate广场四月发帖挑战 The core signal of the Federal Reserve's decision on March 19 is: keep interest rates unchanged (3.50%–3.75%), and that "high interest rates" will persist longer. The main impacts on the global economy are reflected in rising funding costs, a strengthening dollar, and slowing growth.
1. Global Financial Markets: Valuation and Funding Pressure
U.S. stocks and global equities: High interest rates directly increase corporate financing costs, suppressing valuations of tech and growth stocks. U.S. stocks led the decline (Dow down about 1.6%), and risk asset sentiment worldwide was aff
GLDX-1,9%
View Original
post-image
  • Reward
  • Comment
  • Repost
  • Share
#Gate广场四月发帖挑战 The core strategy for trading contracts in a sideways market is "buy low and sell high, arbitrage within the range." Clearly identify the support level (lower boundary) and resistance level (upper boundary) of the range, and open positions when the price touches the boundary with reversal signals. You can use tools like grid trading to automate execution.
Survival depends on extreme risk management:
Strictly prohibit high leverage; recommended leverage is ≤3x to prevent margin calls and liquidations.
Operate with small positions, and strictly limit single trade stop-loss to 1%-2
View Original
post-image
[The user has shared his/her trading data. Go to the App to view more.]
  • Reward
  • Comment
  • Repost
  • Share
#Gate广场四月发帖挑战 Trump's latest strategic adjustments in March 2026 regarding the Middle East (Iran) and Russia-Ukraine situations. The core logic is a "America First" stop-loss strategy rather than unconditional peace.
## Middle East: "Fight and Talk" with Iran
Currently, the military conflict between the U.S., Israel, and Iran has lasted about a month. Trump has issued clear signals of de-escalation:
- Verbal commitment: On March 9, Trump publicly stated that the conflict with Iran would "end soon" and plans to lift some oil sanctions to stabilize oil prices.
- Substantive conditions: The U.S.
View Original
  • Reward
  • Comment
  • Repost
  • Share
#Gate广场四月发帖挑战 Tom Lee's judgment is more based on "historical statistical patterns" and "extreme sentiment signals" on the left side, rather than a confirmed fundamental reversal on the right side. In the current environment of high macro and geopolitical uncertainty, my strategy is to: gradually allocate to core assets, but never blindly go all-in to catch the bottom.
### 1. Why is "building a bottom" logical but not absolutely safe?
Tom Lee's core argument relies on the historical patterns of "debt absorption" and "war bottom":
- Debt absorption: He believes that about 90%–95% of declines in
BTC0,46%
ETH0,44%
View Original
  • Reward
  • Comment
  • Repost
  • Share
#Gate广场四月发帖挑战 Celebration begins!🧧
Post to earn, daily red envelopes to claim, 100% chance to win for newcomers!
🎁 Benefits Highlights:
✅ Newcomer Gift: Post your first message in the plaza, guaranteed red envelope!
✅ Posting Rewards: The more you post, the more interactions you get, and the bigger the red envelopes!
✅ Sharing King: Share the event link to the plaza or external platforms, and receive a Gate bottle opener + 200U!
✅ Leaderboard: Top 100 winners will receive prizes, including Gate 13th Anniversary Limited Gift Box, Red Bull jackets, and more!
Take action now and p
View Original
post-image
  • Reward
  • Comment
  • Repost
  • Share
#四月行情预测 April Cryptocurrency Market: Rebound Volatility, Beware of Liquidity Traps
The current market is in a "recovery and consolidation" phase. After consecutive declines, sentiment has improved, but the momentum for a sustained bull run is lacking. The main drivers are the inflow of spot ETF funds and technical rebound demands.
Key Point: April is expected to see a range-bound market with a top and bottom. BTC's core trading range is between $65,000 and $72,000, with ETH following, fluctuating between $2,000 and $2,300. Whether BTC can effectively hold above $68,000 and break through $72,00
BTC0,46%
ETH0,44%
SOL0,6%
BNB-0,2%
View Original
  • Reward
  • Comment
  • Repost
  • Share
#四月行情预测 The cryptocurrency market in April 2026 is expected to remain volatile within a broad range, consolidating the bottom pattern. After the previous sharp correction, the market has entered a "post-halving" cycle, requiring stronger momentum for a reversal.
Core trend: BTC's main trading range is $60,000 - $75,000, with ETH following at $1,800 - $2,300. The market will repeatedly test support levels, making a one-sided trend unlikely.
Key drivers:
Macro factors: The Middle East situation and oil prices are the biggest variables, influencing global liquidity expectations and risk appetite
BTC0,46%
ETH0,44%
View Original
  • Reward
  • Comment
  • Repost
  • Share
#四月行情预测 The cryptocurrency market in April 2026 is expected to remain volatile within a wide range, consolidating a bottom pattern. After the previous sharp correction, the market has entered a "post-halving" cycle, requiring stronger momentum for a reversal.
Core Trend: BTC's main trading range is $60,000 - $75,000, with ETH following at $1,800 - $2,300. The market will repeatedly test support levels, making a one-sided trend unlikely.
Key Drivers:
Macro Factors: The Middle East situation and oil prices are the biggest variables, influencing global liquidity expectations and risk appetite.
C
BTC0,46%
ETH0,44%
View Original
  • Reward
  • 1
  • Repost
  • Share
NiaGoodvip:
Beware of black swan events in global macro policies (especially U.S. regulations) and the liquidation risks brought by high leverage during volatile markets.
#特朗普释放停战信号 The "ceasefire signals" you see are the latest strategic adjustments by Trump in March 2026 regarding the Middle East (Iran) and Russia-Ukraine situations. The core logic is a "America First" stop-loss strategy, rather than unconditional peace.
Middle East: "Fight and Talk" with Iran
Currently, the U.S. and Israel have been engaged in military conflict with Iran for about a month. Trump has sent clear signals of de-escalation:
Verbal commitments: On March 9, Trump publicly stated that the conflict with Iran would "end soon" and plans to lift some oil sanctions to stabilize oil pric
View Original
  • Reward
  • Comment
  • Repost
  • Share
#Gate金手指 If only the ocean could be turned into pure gold, that would be great.
View Original
post-image
  • Reward
  • Comment
  • Repost
  • Share
Gate广场_Officialvip
🌟 Gate Plaza | The Golden Finger Challenge!
Everything can be gold! Show off your "Turning Stone into Gold" superpower and win limited edition merchandise and USD rewards!
🎁 Interactive Giveaway
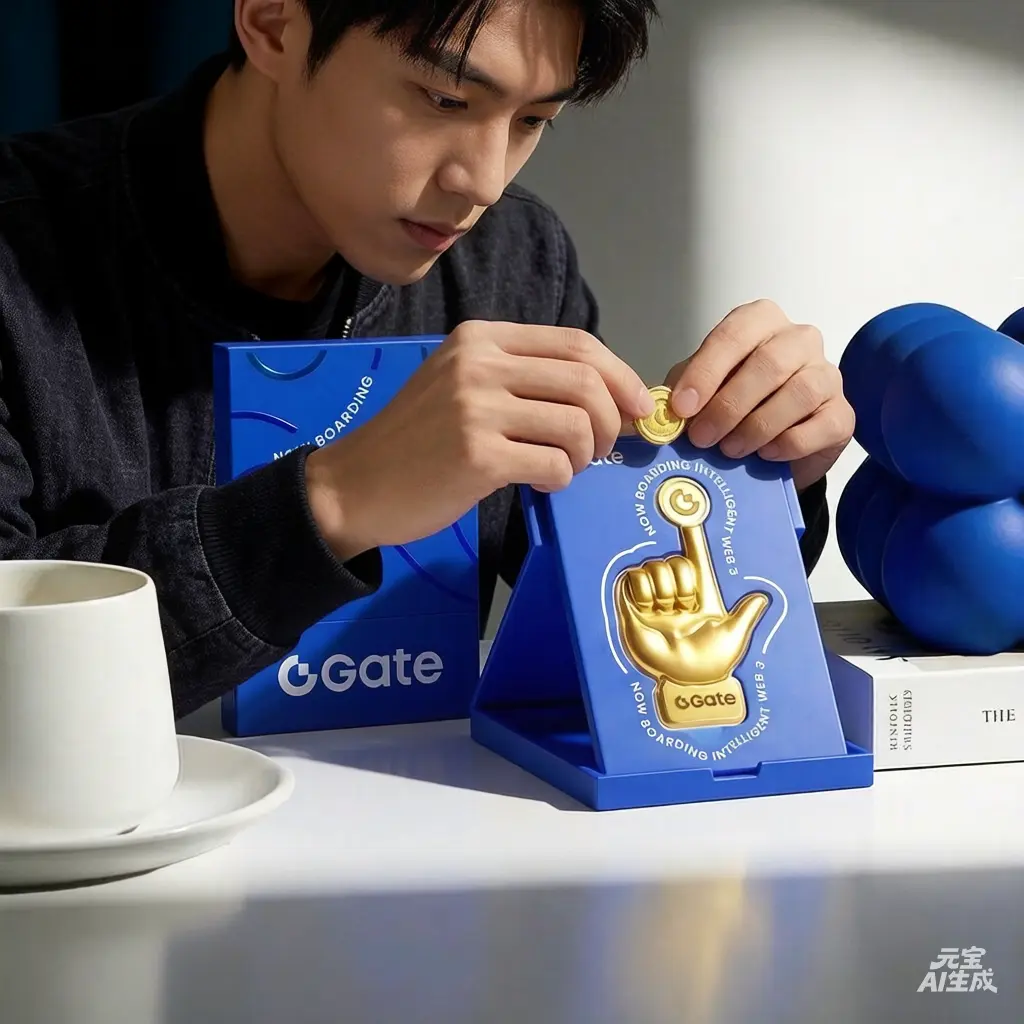
Creative Award (3 winners): Gate exclusive "Golden Finger" limited edition merchandise
Lucky Award (10 winners): $50 Contract Experience Voucher
👇 Quick Participation
1️⃣ Follow @GatePlaza_Official + Like and Share
2️⃣ Choose one to participate:
Comment: What would you most like to turn into pure gold?
Post with the hashtag #Gate金手指 : Share your "Golden Finger" interaction photo (real shot/AI generated)
The more creative your idea, the higher your chances of winning! Come and unlock your golden moment!
repost-content-media
  • Reward
  • Comment
  • Repost
  • Share
#BTC能否守住6.5万美元? As of March 30, 2026, BTC is in a "weak equilibrium" near $65,000. Although the market has temporarily held this level, the support strength is weakening. If macroeconomic bearish factors persist, there is a high risk of breaking below.
📉 Current market: Holding on barely, but very fragile
Price performance: BTC is currently around $66,000–$67,000. This morning, it briefly fell below $65,000 (bottomed at $64,998), then rebounded in a V-shape, indicating bullish resistance at this level, but the rebound is weak.
Technical signals: $65,000 is generally seen as a short-term "life
BTC0,46%
View Original
  • Reward
  • 1
  • Repost
  • Share
NiaGoodvip:
The US-Iran conflict has driven up oil prices, intensified inflation concerns, and cooled market expectations for a Federal Reserve rate cut, continuing to suppress risk asset appetite.
  • Pin