

政和徐婷
Trade
Trading Type
Spot
Trade crypto freely
Alpha
Points
Get promising tokens in streamlined on-chain trading
Pre-Market
Trade new tokens before they are officially listed
Margin
Magnify your profit with leverage
Convert & Block Trading
0 Fees
Trade any size with no fees and no slippage
Leveraged Tokens
Get exposure to leveraged positions simply
Futures
Futures
Hundreds of contracts settled in USDT or BTC
Options
HOT
Trade European-style vanilla options
Unified Account
Maximize your capital efficiency
Demo Trading
Futures Kickoff
Get prepared for your futures trading
Futures Events
Participate in events to win generous rewards
Demo Trading
Use virtual funds to experience risk-free trading
Earn
Launch
CandyDrop
Collect candies to earn airdrops
Launchpool
Quick staking, earn potential new tokens
HODLer Airdrop
Hold GT and get massive airdrops for free
Launchpad
Be early to the next big token project
Alpha Points
NEW
Trade on-chain assets and enjoy airdrop rewards!
Futures Points
NEW
Earn futures points and claim airdrop rewards
Investment
Simple Earn
Earn interests with idle tokens
Auto-Invest
Auto-invest on a regular basis
Dual Investment
Buy low and sell high to take profits from price fluctuations
Soft Staking
Earn rewards with flexible staking
Crypto Loan
0 Fees
Pledge one crypto to borrow another
Lending Center
One-Stop Lending Hub
VIP Wealth Hub
Customized wealth management empowers your assets growth
Private Wealth Management
Customized asset management to grow your digital assets
Quant Fund
Top asset management team helps you profit without hassle
Staking
Stake cryptos to earn in PoS products
BTC Staking
HOT
Stake BTC and earn 10% APR
GUSD Minting
Use USDT/USDC to mint GUSD for treasury-level yields
More
政和徐婷
No content yet
- Reward
- 4
- 1
- 1
- Share
政和徐婷:
15:47 got it 🖕Ethereum $ETH price movement is mainly positively correlated with the Fed's rate cuts; rate cuts usually drive its price to pump, but in special scenarios like recessionary rate cuts, this correlation can weaken or even reverse. The specific relationship is as follows:
1. Conventional rate cuts drive price movement: The Fed's rate cuts increase market liquidity, reduce borrowing costs for banks and corporate financing, and funds that would originally be directed towards low-yield assets like bonds will shift towards high-return risk assets like Ethereum. At the same time, rate cuts ar
1. Conventional rate cuts drive price movement: The Fed's rate cuts increase market liquidity, reduce borrowing costs for banks and corporate financing, and funds that would originally be directed towards low-yield assets like bonds will shift towards high-return risk assets like Ethereum. At the same time, rate cuts ar
ETH-5.52%
- Reward
- 4
- 1
- Repost
- Share
ZhuoQiangGeΠ :
:
Just go for it💪The Fed's interest rate cut situation in December shows that the current market and institutions widely expect a 25 basis point cut from the Fed in December, but there is still some uncertainty. Here are the detailed predictions from the Fed:
1. Institutional Forecasts: JP Morgan adjusted its forecast twice within a week, ultimately believing that the Fed will lower interest rates by 25 basis points in December, with another cut expected in January next year; Goldman Sachs also anticipates that the Fed will implement a third consecutive rate cut in December, citing slowing inflation and a
View Original1. Institutional Forecasts: JP Morgan adjusted its forecast twice within a week, ultimately believing that the Fed will lower interest rates by 25 basis points in December, with another cut expected in January next year; Goldman Sachs also anticipates that the Fed will implement a third consecutive rate cut in December, citing slowing inflation and a

- Reward
- 4
- Comment
- Repost
- Share
Ethereum $ETH has recently shown a fluctuating downward trend in price, significantly retreating from the historical high point in August, while short-term fluctuations are evident. The specific trend is as follows:
1. Short-term trend: As of November 30, 2025, the price of Ethereum is approximately $3020 - $3040. In the past 24 hours, the price fluctuated between $2961 - $3045, with a decline of about 1.34%-1.46%; looking back over the past week (November 23 - November 30), although there was a single-day increase of 5.39% on November 24, the overall trend has been a decline, fluctuating fro
1. Short-term trend: As of November 30, 2025, the price of Ethereum is approximately $3020 - $3040. In the past 24 hours, the price fluctuated between $2961 - $3045, with a decline of about 1.34%-1.46%; looking back over the past week (November 23 - November 30), although there was a single-day increase of 5.39% on November 24, the overall trend has been a decline, fluctuating fro
ETH-5.52%

- Reward
- 9
- 4
- 1
- Share
Quang207 :
:
The Central Bank of China reiterates the ban on cryptocurrencies💰 and warns that it will strengthen the crackdown on stablecoins❎.View More
Subscribe to Apple here👇
https://www.gate.com/zh/profile/%E6%94%BF%E5%92%8C%E5%BE%90%E5%A9%B7
View Originalhttps://www.gate.com/zh/profile/%E6%94%BF%E5%92%8C%E5%BE%90%E5%A9%B7
- Reward
- 5
- Comment
- Repost
- Share
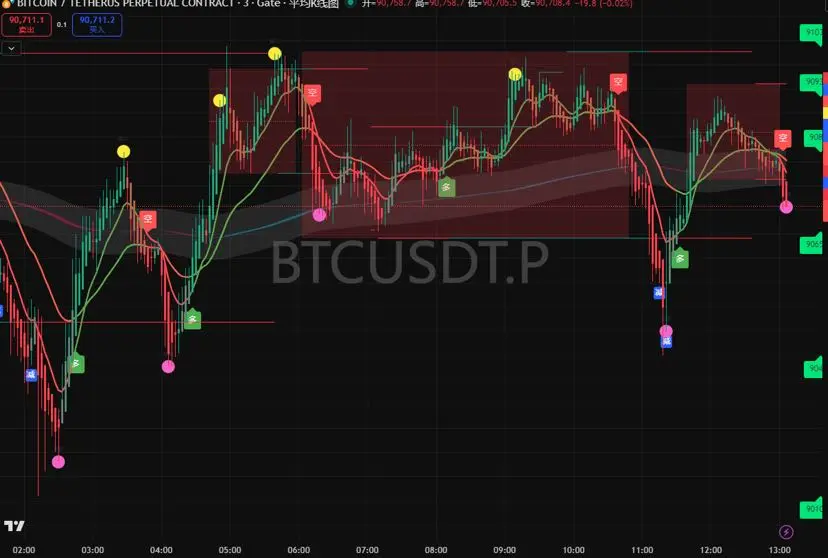
BTC market data and key price analysis
Price and recent trends: BTC fluctuated in a narrow range of 90155 - 91165 USD on the day, currently trading around 90800 USD. The 4-hour chart shows that it has dropped from a high of 93092 USD and is stuck near the middle band of the Bollinger Bands. The MACD shows a death cross, but the green bars have not expanded. The KDJ shows signs of turning, with bullish and bearish forces temporarily balanced. Trading volume is gradually shrinking, and there is a strong wait-and-see sentiment in the market.
Key price levels: The upper resistance level to watch i
BTC-5.08%
- Reward
- 5
- Comment
- Repost
- Share
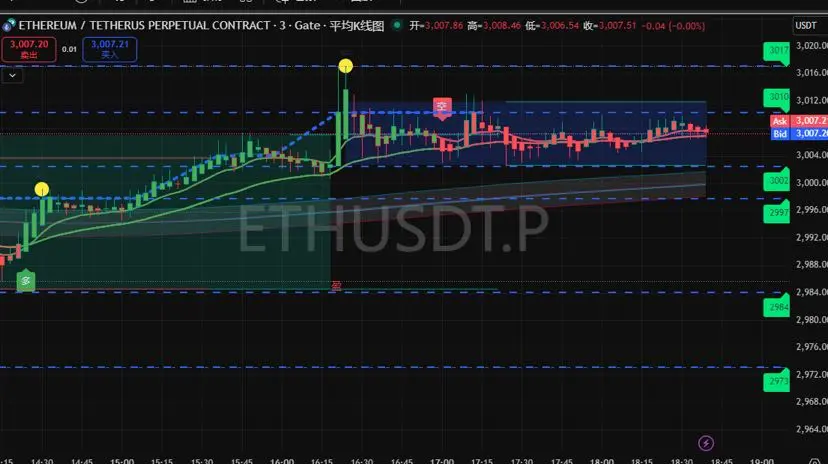
Analysis of Zhenghe ETH market data and key price levels
Price and Recent Trends: The performance of ETH has been quite volatile today, first breaking below the 3000 US dollar threshold, hitting a low of 2960 US dollars, after previously soaring to 3099 US dollars and then quickly coming under pressure. As of the afternoon, both the hourly and 4-hour charts are showing a fluctuating trend, with rebound volume gradually decreasing, and it has already fallen below the short-term upward trend channel, facing significant selling pressure for any subsequent rebound.
Key price levels: Short-term res
ETH-5.52%
- Reward
- 4
- 1
- Repost
- Share
政和财神官 :
:
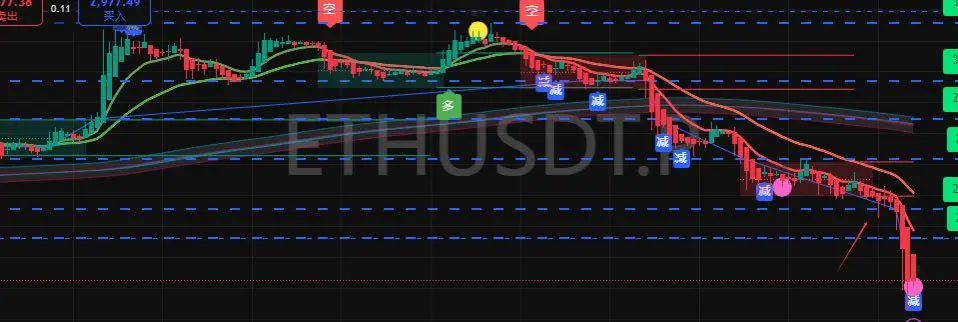
Just go for it💪ETH Zhenghe Technical Analysis Report for Late November 2025
Recent market background: Ethereum also experienced a significant decline in November, with a monthly drop of 24.8%, falling from $3918 to $2946. On the 27th, the market rebounded and broke through the key psychological level of $3000, and on the 28th, the price faced resistance and pulled back around the $3070 level, entering a consolidation phase.
Interpretation of Core Technical Indicators
MACD Indicator: The daily level histogram has turned red for five consecutive days, although it remains below the zero line, the momentum recov
ETH-5.52%

- Reward
- 6
- Comment
- Repost
- Share
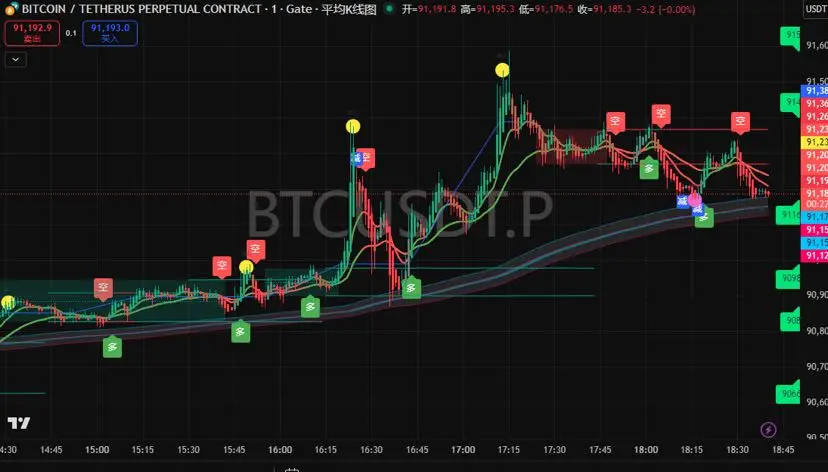
BTC Zhenghe Technical Analysis Report for Late November 2025
Recent market background: Bitcoin experienced a significant plunge in November, dropping from its historical peak of $126,000 on October 12 to a phase low of $89,000 on the 18th, a decline of 29%. On the 27th, it saw a strong rebound, returning to the $90,000 mark, and on the 29th, it was in a box consolidation phase, maintaining the $91,000 level, with intense long and short battles.
Interpretation of Core Technical Indicators
RSI Indicator: The daily RSI reading has rebounded from the oversold area, indicating a relief in downward
BTC-5.08%
- Reward
- 4
- Comment
- Repost
- Share
11.30 short-term operation: The current price fluctuates around 2995, with short-term support at 2960 and resistance levels at 3048 - 3100. You can go long near 2970 - 2980, set a stop loss of 50 points, and aim for 3020 - 3040; you can try shorting in the range of 3025 - 3100, set a stop loss of 50 points, and aim for a downward target of 3000 - 2950. If the 2960 support holds, you can perform ultra-short northbound operations, and exit promptly if it breaks down.
Medium-term outlook: The medium-term support is at 2750, with strong resistance at 3170 above. If the price can stabilize at 3100
Medium-term outlook: The medium-term support is at 2750, with strong resistance at 3170 above. If the price can stabilize at 3100
ETH-5.52%
- Reward
- 4
- Comment
- Repost
- Share
On November 29, 2025, Ethereum $ETH will move in tandem with Bitcoin, showing a high-level fluctuation pattern. Additionally, the trading volume over the weekend is likely to be low, and the fluctuation will be narrow. The trading strategy is recommended to focus on buying low and selling high within the range, while operating with a light position. At the same time, closely monitor key data and points, as detailed below:
1. Long Strategy: You can try long positions in the 3000 - 2990 range. If it pulls back and stabilizes at 2937, you can also try a Light Position. A more conservative long p
1. Long Strategy: You can try long positions in the 3000 - 2990 range. If it pulls back and stabilizes at 2937, you can also try a Light Position. A more conservative long p
ETH-5.52%

- Reward
- 8
- 3
- Repost
- Share
GateUser-bd346df0:
You did a great job publishing, your letters are exceptional 🥰🥰🥰🥰🥰View More
Technical Analysis and trading strategy for政和 (SOL) on November 29
Key Price Level (USD)
• Support Level: First support at 135, strong support at 130 (the key bottom where multiple rebounds have stabilized, significantly rising after touching this area twice in historical trends), extreme support at 95 (key point of the rising trend line, breaking below will strengthen the downward tone).
• Resistance levels: First resistance at 160 (20-day EMA position), strong resistance at 170 (neckline resistance area of the V-shaped reversal pattern), target resistances at 200, 250 (if the neckline is bro
SOL-7.08%

- Reward
- 5
- Comment
- Repost
- Share
Three major illusions of Cryptocurrency Trading: This is the bottom, there will be a Rebound, I can make a profit, corresponding to three major realities: buying at the halfway up, trapped at the highest point. #成长值抽奖赢iPhone17和周边 $BTC
BTC-5.08%

- Reward
- 3
- Comment
- Repost
- Share
On November 29, the current price is $3030, fluctuating around the 3000 mark. The trend is weaker than Bitcoin's previous drop to around 2984, followed by a rebound to 3045. Subsequently, multiple tests of the 3100 mark have all retraced, with market makers showing significant selling pressure at this high level, indicating a short-term consolidation at elevated levels.
Strategy👇
View OriginalStrategy👇
Subscribers Only
Subscribe now to view exclusive content- Reward
- 4
- Comment
- Repost
- Share
ETH11.28 Depth Analysis
1. Overall Trend: After a slight rise at a high level, it faced pressure around the 3070 line and retraced, entering a period of fluctuation. The 15-minute chart shows a converging triangle pattern, with lower highs and higher lows. A shift in trend may occur tonight, with a relatively higher probability of an upward movement.
2. Key levels: In the short term, fluctuations are expected in the range of 2980 - 3085. Resistance above is focused on the 3100 - 3130 line, with further resistance in the range of 3170 - 3200; support below is at the 2930 line, and if the neckli
ETH-5.52%

- Reward
- 5
- Comment
- Repost
- Share
On November 28, 2025, midday Ethereum $ETH held the key position of $3000, showing a fluctuating trend. Overall, it continues the recent rebound momentum but is relatively weaker compared to Bitcoin's performance. Additionally, the 4-hour MACD divergence indicates a pullback demand. Below is a detailed trend analysis and midday trading suggestions:
1. Trend details:
Midday Ethereum fluctuates around the 3000 mark, previously reaching a high of 3071.37 USD and a low of 2985.78 USD. From a technical perspective, the daily chart shows a series of upward movements, with the moving averages di
1. Trend details:
Midday Ethereum fluctuates around the 3000 mark, previously reaching a high of 3071.37 USD and a low of 2985.78 USD. From a technical perspective, the daily chart shows a series of upward movements, with the moving averages di
ETH-5.52%
- Reward
- 4
- 2
- Repost
- Share
On November 27th, Ethereum has broken through the $3000 mark, showing a volatile upward trend, but the hourly chart has short-term adjustment signals. The long and short strategies need to be formulated in conjunction with key support and resistance levels. Below are the mainstream trading ideas for that day:
1. Long Strategy: There are two types of entry timing. First, enter lightly after a pullback stabilizes in the range of $2950 - $2980, with a stop loss of around 30 points and a target towards $3080 - $3150; second, if the pullback is larger, wait for a drop to the range of $2781 - $2831
1. Long Strategy: There are two types of entry timing. First, enter lightly after a pullback stabilizes in the range of $2950 - $2980, with a stop loss of around 30 points and a target towards $3080 - $3150; second, if the pullback is larger, wait for a drop to the range of $2781 - $2831
ETH-5.52%

- Reward
- 5
- 2
- Repost
- Share
GoodLuckVIP888 :
:
Hurry, enter a position! 🚗View More
- Reward
- 4
- Comment
- Repost
- Share
November 27 Core Technical Indicators: The daily chart MACD has formed a golden cross and the red bars continue to expand, releasing bullish signals, but the DIF value is still below the zero axis at -214, indicating that mid-term upward momentum needs to be repaired; the hourly chart MACD has shown the early signs of a high-level death cross, suggesting a high probability of a small adjustment in the short term. The RSI indicator has rebounded from the oversold area, indicating that the market's bearish momentum is gradually weakening. In terms of moving averages, the EMA7 has crossed abo
ETH-5.52%

- Reward
- 5
- Comment
- Repost
- Share
