 Samson Mow, CEO of Bitcoin technology firm Jan3, stated on March 1, 2026, that Bitcoin is currently undervalued relative to gold by approximately 24% to 66%, suggesting a potential price reversal.
Mow cited the Bitcoin-to-gold ratio’s Z-score, which measures deviation from historical averages, noting that readings below -2 have historically preceded major Bitcoin rallies, with the current Z-score standing at approximately -1.24. The analysis comes as gold futures for April delivery closed at $5,247.90 on February 28, while Bitcoin traded near $66,400 amid ongoing geopolitical tensions following strikes on Iran.
Bitcoin-to-Gold Z-Score Signals Historical Undervaluation
The Z-score of the Bitcoin-to-gold ratio measures how many standard deviations the current ratio deviates from its historical mean. A Z-score of zero indicates alignment with the historical average, while negative values indicate undervaluation of Bitcoin relative to gold.
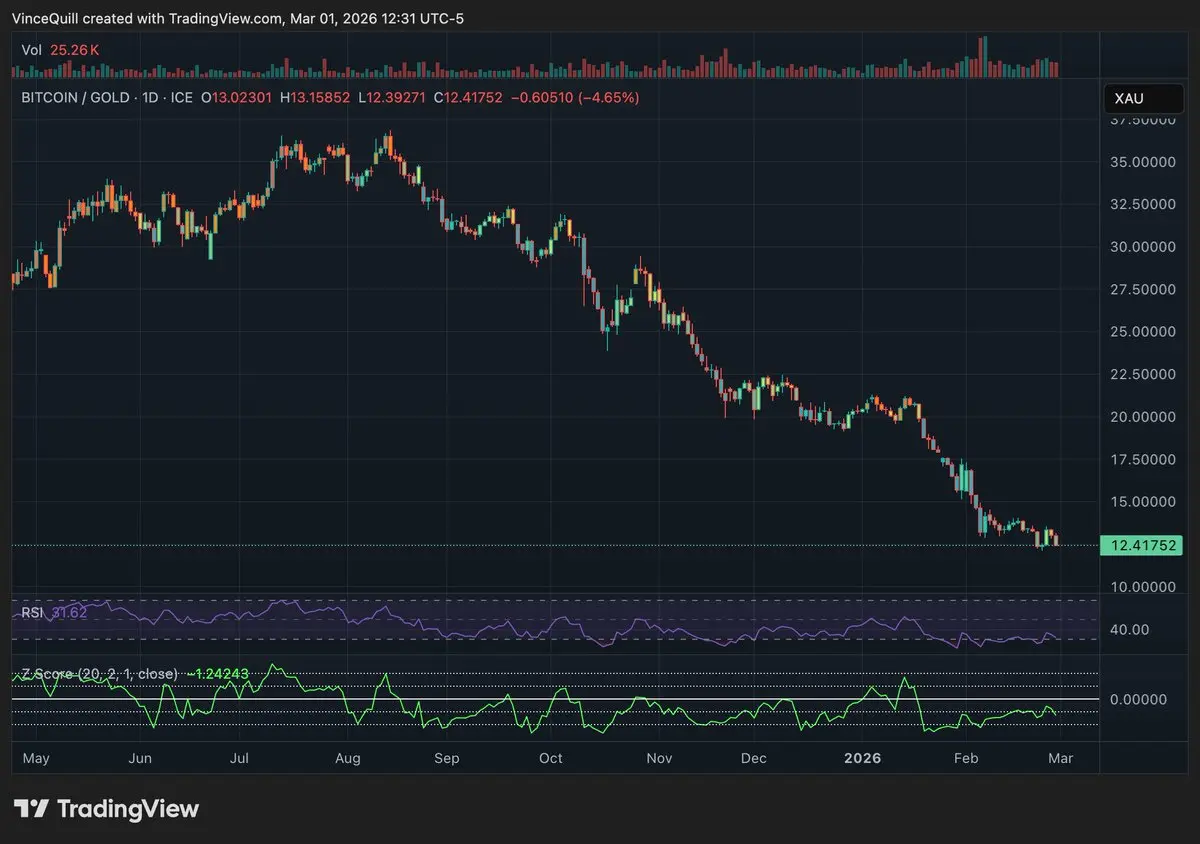 (Source: TradingView)
Mow highlighted that when this metric drops below -2, Bitcoin has historically experienced substantial price appreciation. The current Z-score of approximately -1.24 remains above this threshold but indicates significant relative undervaluation.
Historical data shows two previous instances where extreme Z-score readings preceded major Bitcoin rallies. In November 2022, amid the collapse of cryptocurrency exchange FTX, the Z-score fell below -3, and Bitcoin subsequently rallied over 150% in the following 12 months. During the March 2020 COVID-19 market crash, the metric dropped below -2 as Bitcoin reached approximately $3,717, followed by a surge exceeding 300% over the next year, culminating in the November 2021 all-time high near $69,000.
Analysts who conceptualized power-law bands for the BTC-gold ratio stated in January 2026 that “everything points to Bitcoin massively outperforming gold over the coming months” based on these valuation metrics. Historical patterns indicate that Bitcoin’s strongest price appreciation phases typically follow gold bull runs by two months to over a year.
Gold’s Record Highs Widen Valuation Gap with Bitcoin
Gold futures for April delivery closed at $5,247.90 on February 28, while tokenized gold PAX Gold traded at $5,404.14 at the time of reporting. Gold has risen more than 80% over the past year, benefiting from global uncertainty measured by the World Uncertainty Index, which has increased amid trade tariffs, domestic institutional disputes in the U.S., and rising tensions with China and Iran.
Mow characterized gold as “overextended” while Bitcoin remains significantly below its trend line relative to gold’s market capitalization and global money supply. This divergence has created what Mow describes as a 24% to 66% undervaluation gap for Bitcoin compared to its historical trend against gold.
The Bitcoin-to-gold ratio, which measures the amount of gold equivalent to one Bitcoin, has declined approximately 55% from its late 2024 peak, placing Bitcoin in a technical bear market against gold for approximately 14 months. The ratio currently stands at levels last seen during previous market cycles.
Market Divergence: Bullish Z-Signal Versus Bearish Price Forecasts
Mow’s analysis presents a contrarian view to other market observers who forecast continued downside for Bitcoin amid geopolitical uncertainty. Some analysts project Bitcoin could decline toward $50,000, suggesting current price action may mirror the 2022 bear market structure.
Bitcoin fell over 50% from peak to trough, reaching a low near $60,000 before staging a limited recovery to approximately $66,400 following weekend developments in the Middle East. The decline coincided with outflows from spot Bitcoin ETFs, with approximately $7.8 billion exiting since November, representing about 12% of total ETF assets.
However, large-scale investors have treated the downturn as an accumulation opportunity. Abu Dhabi’s major investment firms added spot Bitcoin ETF exposure in mid-February 2026.
Mercado Bitcoin Analysis Suggests Potential March Bottom in Gold Terms
Market analysis examining Bitcoin’s potential bottom timeline through the lens of gold-denominated prices reveals divergent patterns. In U.S. dollar terms, Bitcoin’s most recent peak occurred in October 2025 at approximately $126,000. If the current cycle follows historical patterns lasting 12 to 13 months, the downturn could extend into late 2026.
However, when priced in gold, the timeline shifts. Bitcoin reached its high against gold in January 2025. Applying the same 12- to 13-month pattern would place a potential bottom around February 2026, with a recovery possibly beginning in March.
Analysts note that Bitcoin weakened against gold sooner than it did against the dollar as capital rotated into bullion amid global uncertainty. Investors are advised to employ dollar-cost averaging strategies during periods of market fear, as historical data suggests that “buying during periods of fear has been more effective than buying during euphoria.”
FAQ: Bitcoin and Gold Valuation
What is the Bitcoin-to-gold Z-score and what does it indicate?
The Z-score measures how many standard deviations the Bitcoin-to-gold ratio deviates from its historical average. A Z-score below -2 has historically preceded major Bitcoin rallies. The current Z-score of approximately -1.24 indicates Bitcoin is undervalued relative to gold but has not yet reached the extreme -2 threshold that triggered previous major rallies.
How much is Bitcoin undervalued compared to gold according to Samson Mow?
Samson Mow estimates Bitcoin is undervalued by approximately 24% to 66% relative to its trend line against gold’s market capitalization and global money supply. He characterizes gold as “overextended” at current record highs above $5,200 per ounce.
What are the conflicting price forecasts for Bitcoin?
Bullish analysts point to historical Z-score patterns suggesting potential upside, with previous instances following extreme undervaluation producing 150% to over 300% gains in subsequent months. Bearish analysts cite geopolitical uncertainty, ETF outflows, and technical patterns resembling the 2022 bear market, with some forecasting a potential decline toward $50,000.
Disclaimer: The information on this page may come from third parties and does not represent the views or opinions of Gate. The content displayed on this page is for reference only and does not constitute any financial, investment, or legal advice. Gate does not guarantee the accuracy or completeness of the information and shall not be liable for any losses arising from the use of this information. Virtual asset investments carry high risks and are subject to significant price volatility. You may lose all of your invested principal. Please fully understand the relevant risks and make prudent decisions based on your own financial situation and risk tolerance. For details, please refer to
Disclaimer.
Related Articles
Polymarket: Bitcoin has 61% chance of reaching $60K before $80K
Polymarket data indicates traders anticipate Bitcoin will decline before a significant rise. The probability of BTC reaching $60,000 before $80,000 is now at 61%, reflecting cautious market sentiment amid macro volatility and selling pressure. The possibility of Bitcoin breaking past $80,000 remains, depending on stronger supportive factors.
TapChiBitcoin13m ago
Last week, Bitcoin spot ETF experienced a net inflow of $95.18 million, marking four consecutive weeks of net inflows.
Last week, Bitcoin spot ETF net inflows reached $95.18 million, marking four consecutive weeks of growth. Among them, BlackRock's IBIT had the largest inflows at $191 million, with a total net inflow of $63.26 billion. Fidelity's FBTC experienced net outflows of $50.07 million. In terms of total assets, the current net asset value of Bitcoin spot ETFs is $90.3 billion.
GateNews19m ago
The crypto market is widely declining, with BTC breaking below $68,000, while AI and Meme sectors rally against the trend with gains exceeding 3%
On March 23, the crypto market experienced widespread declines, with Bitcoin and Ethereum falling 1.42% and 1.78% respectively. The RWA sector suffered a significant drop of 4.85%, while AI and Meme sectors bucked the trend with gains of 10.36% and 3.66% respectively. Other sectors showed mixed performance, with overall market sentiment remaining weak.
GateNews1h ago
Michael Saylor Signals Continued Bitcoin Accumulation as Funding Strategy Shifts Toward STRC Preferred Stock
Strategy Executive Chairman Michael Saylor posted on March 22, 2026, that "The Orange March Continues," signaling the company's ongoing Bitcoin accumulation as total holdings reached 761,068 BTC valued at approximately $52.36 billion with an average acquisition cost of $75,696 per coin.
CryptopulseElite1h ago
BTC rises 0.61% in 15 minutes: Whale fund inflows superimposed with futures premium resonance driving
Between 2026-03-23 02:15 and 2026-03-23 02:30 (UTC), BTC yield recorded +0.61%, with prices fluctuating between 67807.1 and 68304.9 USDT, representing a volatility of 0.73%. During this short-term volatility period, market trading activity was robust, with enhanced linkage between spot and futures markets, and sustained volume increase in core trading zones, attracting market attention.
The primary driver of this volatility was significant capital inflow from on-chain whale wallets to exchanges during the window period, with approximately 17,184 BTC flowing in within a short timeframe, marking a new monthly high. M
GateNews1h ago
