
Key Takeaways
-
Hyperliquid (HYPE) surged over 8%, reclaiming the $23.30 level amid rising market interest.
-
DefiLlama data shows Hyperliquid leading perpetual futures volume over the last 30 days, topping $160 billion.
-
Strong derivatives activity suggests sustained trader demand and growing ecosystem traction.
-
The daily chart highlights a Bearish Shark harmonic pattern, allowing room for short-term upside.
Hyperliquid’s native token, HYPE, is back in the spotlight today after posting a 8%+ price jump, pushing above the $23.30 level. While the price move itself has caught traders’ attention, a deeper look at on-chain metrics and the daily chart suggests there may be more developing beneath the surface.
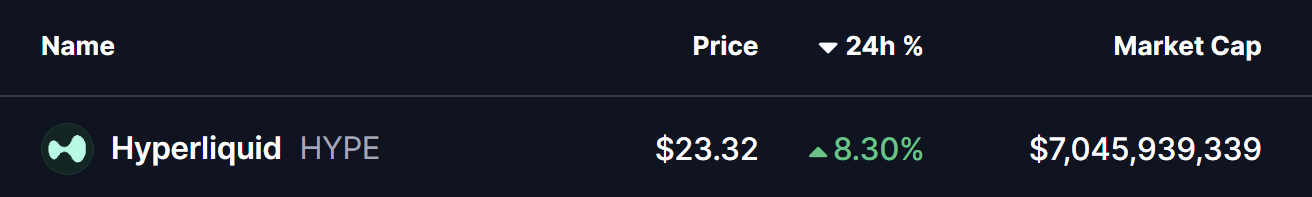
Source: Coinmarketcap
Hyperliquid (HYPE) Leads Perp Volume
According to DefiLlama data, **Hyperliquid **has emerged as the **top perpetual futures **platform by trading volume over the last 30 days, significantly outperforming its closest competitors. The protocol recorded approximately $160.4 billion in perpetual volume, comfortably ahead of Aster and Lighter, which logged around $124.7 billion and $112.5 billion, respectively.
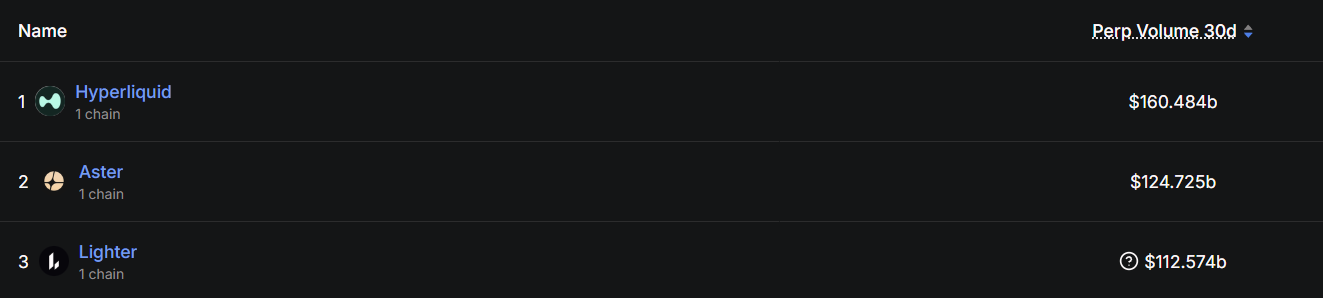
Source: Defillama
This surge in activity highlights growing trader preference for Hyperliquid’s ecosystem, signaling strong demand, deep liquidity, and sustained engagement. Historically, rising derivatives volume often acts as a leading indicator for increased interest in a project’s native token — something that appears to be playing out in HYPE’s recent price action.
Is More Upside Ahead?
From a technical perspective, HYPE’s daily chart reveals the development of a Bearish Shark harmonic pattern, a well-known formation in technical analysis. While this pattern ultimately suggests a potential reversal once fully completed, it often allows for short-term bullish continuation as price moves toward the “C” point.
Following the completion of the O-X-A-B structure, HYPE is currently trading around $23.26, holding above its recent lows. The next key challenge for bulls lies at the 50-day moving average near $25.72, which has acted as a dynamic resistance zone.
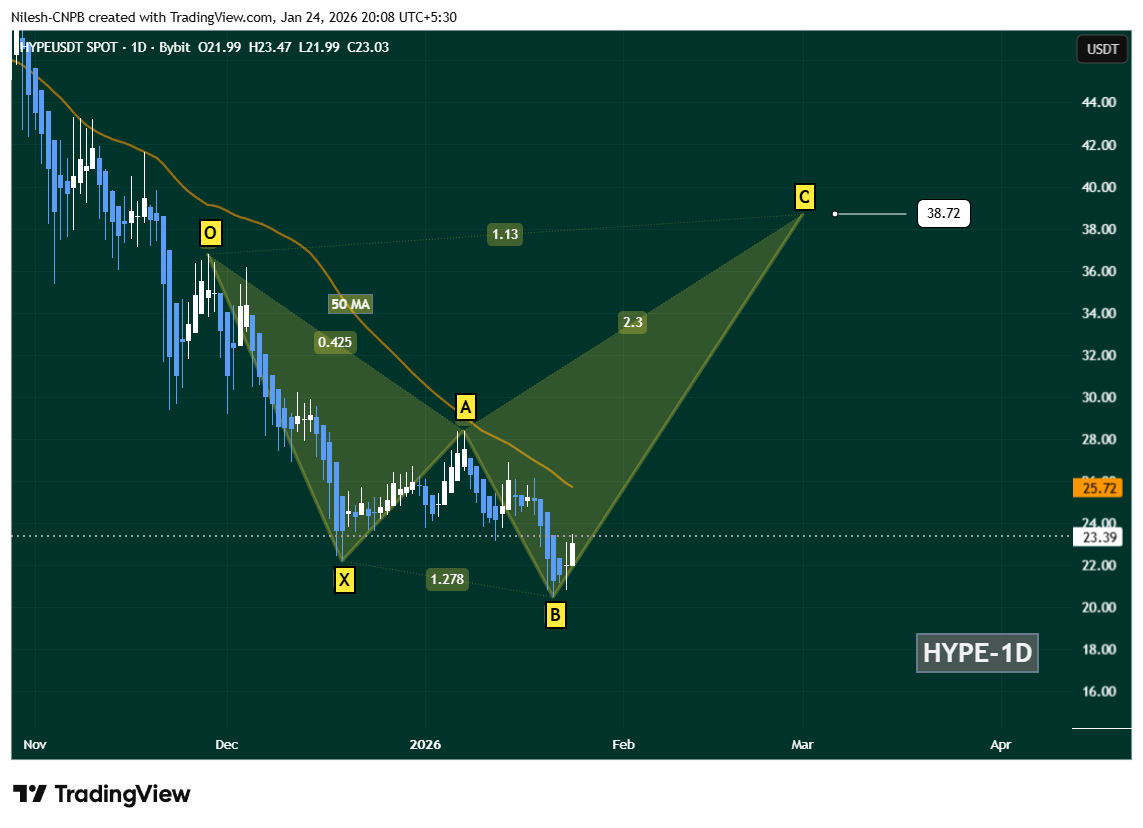
Hyperliquid (HYPE) Daily Chart/Coinsprobe (Source: Tradingview)
A decisive daily close above the 50-day MA ($25.72) would strengthen the recovery narrative and could open the door for a broader upside move. If momentum continues to build, the chart projects a potential advance toward the C-point near $38.72, aligning with the Shark pattern’s 1.13 Fibonacci extension.
However, downside risks remain. A failure to hold the B-point support zone would invalidate the bullish continuation setup and could expose HYPE to extended consolidation or further downside pressure in the near term.
Bottom Line
HYPE’s price rebound is being backed by strong on-chain fundamentals, with Hyperliquid clearly dominating the perpetual trading landscape. While the broader harmonic structure suggests caution in the longer term, short-term technicals still favor a recovery move as long as key support levels remain intact. All eyes now remain on the $25.72 reclaim, which could act as the trigger for the next leg higher.
Disclaimer: The views and analysis presented in this article are for informational purposes only and reflect the author’s perspective, not financial advice. Technical patterns and indicators discussed are subject to market volatility and may or may not yield the anticipated results. Investors are advised to exercise caution, conduct independent research, and make decisions aligned with their individual risk tolerance.
About Author: Nilesh Hembade is the Founder and Lead Author of Coinsprobe, with over 5 years of experience in the cryptocurrency and blockchain industry. Since launching Coinsprobe in 2023, he has been providing daily, research-driven insights through in-depth market analysis, on-chain data, and technical research.
Disclaimer: The information on this page may come from third parties and does not represent the views or opinions of Gate. The content displayed on this page is for reference only and does not constitute any financial, investment, or legal advice. Gate does not guarantee the accuracy or completeness of the information and shall not be liable for any losses arising from the use of this information. Virtual asset investments carry high risks and are subject to significant price volatility. You may lose all of your invested principal. Please fully understand the relevant risks and make prudent decisions based on your own financial situation and risk tolerance. For details, please refer to
Disclaimer.
Related Articles
Bitcoin and Gold Correlation Falls to Three-Year Low, Historical Data Suggests March Bottom Reached
As the correlation index between Bitcoin and gold drops to -0.9, analysts believe this indicates Bitcoin may be entering a sideways consolidation phase. The 70% retracement level aligns with historical bear market bottoms, suggesting Bitcoin could be forming a new bull market. Additionally, increased whale holdings in the crypto market and macroeconomic data will influence Bitcoin's future direction.
MarketWhisper3m ago
3 Meme Coins To Watch In The Final Week Of March 2026
The crypto market shows signs of recovery, notably highlighted by a significant $1.8 billion Ethereum purchase that may reverse a recent 9% price drop. Additionally, attention is drawn to three altcoins to monitor as March 2026 concludes.
BeInCrypto3m ago
Trump Releases Iran De-escalation Signals, Bitcoin Surges and Oil Prices Plummet, Market Shows "Golden Trading Window"
On March 24th, Trump's announcement regarding the de-escalation of the Iran situation triggered rapid global market reactions, with stock markets surging, crude oil plummeting, and Bitcoin rising, demonstrating a warming of market risk appetite. Various asset classes showed distinctly different reaction paths to the same event, with some funds capitalizing on early positioning, drawing market attention to information sensitivity.
GateNews6m ago
BTC/Gold Correlation Hits a 3-Year Low — And It Signals a Bitcoin Bottom
The article discusses the significant liquidation risks faced by three altcoins in late March, the reversing correlation between Bitcoin and stocks, and the influence of the Iran war on the Benner Cycle prophecy.
BeInCrypto8m ago
Pi coin breaks critical structural threshold, may retest historical low of $0.13 after 33% plunge
On March 24, Pi Network (PI) price declined to $0.1897, falling more than 33% from the March 13 high. The daily chart shows PI forming a double top structure, approaching historical lows. Capital flow signals indicate increased selling pressure, with the MFI indicator continuing to decline. If it breaks below 40, it may accelerate capital outflows. PI has turned negatively correlated with Bitcoin, showing a technically weakened trend. Key support levels are at $0.1597 and $0.1415, while breaking above $0.1940 could provide room for a rebound.
GateNews11m ago
MICA Daily | Trump Manipulates Market with Words Again? US-Iran Tensions Ease, Markets Rally
Trump announced progress in negotiations with Iran and delayed military action, causing volatility in global investment markets. The crypto market rebounded sharply, with Bitcoin rising above $71,000, traditional markets showed optimism with stock gains and falling oil prices. However, Iran denied negotiations, increasing market uncertainty, which may affect market direction within the next five days. Investors should be cautious and avoid excessive leverage.
区块客15m ago
