
Key Takeaways
-
SKY is forming a rounding bottom pattern on the daily chart
-
Price has rebounded strongly from the $0.0419 demand zone
-
Rising volume supports improving bullish momentum
-
A breakout above $0.0778 could confirm trend reversal
-
Pattern projection points toward the $0.11 region
Sky (SKY), the native governance and utility token of the Sky Protocol (formerly MakerDAO), has stepped into the spotlight after posting a strong daily move of over 8%, accompanied by a sharp 35% surge in trading volume. While the short-term momentum is drawing attention, the more compelling story is unfolding on the higher timeframe chart.
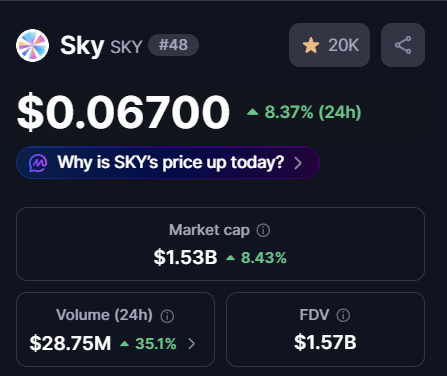
Source: Coinmarketcap
Price action is now forming a classic bullish reversal structure — one that often signals the transition from prolonged weakness into a new recovery phase.
Rounding Bottom Pattern Signals Trend Shift
On the daily timeframe, SKY appears to be completing a rounding bottom formation, a well-known bullish reversal pattern that typically develops after extended downtrends. This structure reflects a gradual shift in market psychology, where persistent selling pressure slowly fades and long-term accumulation begins to dominate.
Earlier in the trend, SKY faced repeated rejection near the $0.0778 neckline resistance, which triggered a steep sell-off. That decline ultimately bottomed near $0.0419, marking a critical demand zone where buyers aggressively stepped in and prevented further downside.
Since establishing this low, price action has steadily curved higher, forming a smooth rounded base. This gradual recovery — rather than a sharp V-shaped bounce — suggests healthier accumulation rather than short-term speculation.
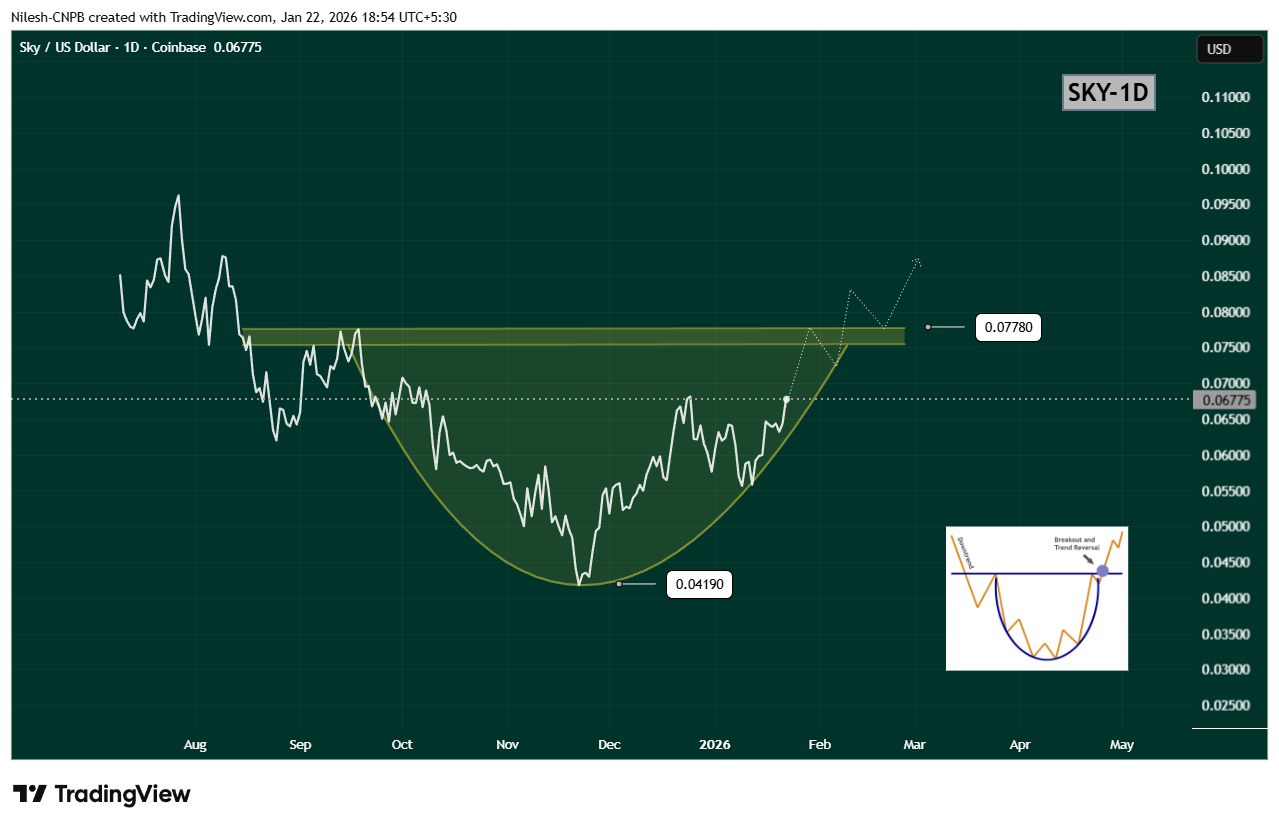
$SKY Daily Chart/Coinsprobe (Source: Tradingview)
Breakout Zone Comes Into Focus
Recent price action shows SKY reclaiming the $0.06933 region, a level that previously acted as resistance. This move strengthens the bullish structure and signals that buyers are gaining confidence ahead of a potential neckline test.
The key level to watch now is the $0.0778 resistance zone. A decisive daily close above this level would confirm the rounding bottom breakout and mark a clear shift in trend structure. Ideally, a breakout followed by a successful retest of this zone as support would further validate the bullish case.
Upside Projection and Risk Outlook
Based on the depth of the rounding bottom, the measured upside projection points toward the $0.11 region. Reaching this target would represent a potential 60–65% upside from current levels, aligning well with historical behavior of similar reversal patterns.
That said, patience remains important. Before any confirmed breakout, SKY could still experience short-term pullbacks or consolidation near the rising curve of the pattern. Such moves would not invalidate the bullish setup, as long as price continues to hold above recent higher lows.
A breakdown below the rounding base would weaken the structure, but for now, momentum favors the bulls.
Bottom Line
SKY is showing clear signs of a trend reversal in progress, with a rounding bottom pattern taking shape on the daily chart. Rising volume, improving structure, and a steady recovery toward neckline resistance all suggest that accumulation is underway.
If SKY can break and hold above $0.0778, the path opens toward the $0.11 region, signaling a broader bullish continuation. Until then, consolidation and minor pullbacks remain possible — but the overall structure is one that traders will be watching closely.
Disclaimer: The views and analysis presented in this article are for informational purposes only and reflect the author’s perspective, not financial advice. Technical patterns and indicators discussed are subject to market volatility and may or may not yield the anticipated results. Investors are advised to exercise caution, conduct independent research, and make decisions aligned with their individual risk tolerance.
About Author: Nilesh Hembade is the Founder and Lead Author of Coinsprobe, with over 5 years of experience in the cryptocurrency and blockchain industry. Since launching Coinsprobe in 2023, he has been providing daily, research-driven insights through in-depth market analysis, on-chain data, and technical research.
Disclaimer: The information on this page may come from third parties and does not represent the views or opinions of Gate. The content displayed on this page is for reference only and does not constitute any financial, investment, or legal advice. Gate does not guarantee the accuracy or completeness of the information and shall not be liable for any losses arising from the use of this information. Virtual asset investments carry high risks and are subject to significant price volatility. You may lose all of your invested principal. Please fully understand the relevant risks and make prudent decisions based on your own financial situation and risk tolerance. For details, please refer to
Disclaimer.
Related Articles
Michael Saylor Warns Quantum Threat Would Break the Internet - U.Today
Michael Saylor argues that quantum computing poses a universal risk beyond Bitcoin, threatening critical global infrastructure. In response to Chamath Palihapitiya's views on AI and market disruptions, Saylor insists that a transition to Post-Quantum Cryptography will protect Bitcoin and other systems together, emphasizing its resilience as "Digital Capital."
UToday15m ago
Analyst Says Bitcoin Indicators Show Early Signs of Market Recovery
Stablecoin liquidity rose by ~$8B since February, signaling potential improved market trading conditions.
Inter-exchange Flow Pulse turned positive, indicating more Bitcoin moving to derivatives platforms.
Long-term holders retain ~79% of supply, showing gradual supply transfers
CryptoFrontNews1h ago
Bitcoin Surges Above $74K After Rally From $60K Support Level
Bitcoin surged from $60K to nearly $74K, gaining 23% as buyers maintained momentum, indicated by a positive RSI and MACD. Key resistance lies at $74K, with support levels at $72.8K, $71.5K, and $70K. Traders anticipate potential further gains.
CryptoFrontNews1h ago
Here’s the Polkadot Price if the Next Upgrade Triggers a DOT Comeback
Polkadot is doing well in the crypto market right now. The DOT price is going up. People are getting interested in it again. Polkadot is one of the performing cryptos in the recent market turnaround.
On March 16, the DOT price saw a sudden increase of 8.5%, making it one of the top
CaptainAltcoin1h ago
XRP Breaks $1.40 Resistance as Volume Surge Lifts Momentum
Key Insights
XRP surged past the $1.40 resistance after trading volume climbed nearly 13%, signaling renewed trader interest and stronger short-term momentum.
Ripple’s collaboration with Mastercard through the Crypto Partner program increased market attention as investors anticipate
CryptoNewsLand2h ago
Dogecoin at a Turning Point — Will $0.094 Resistance Finally Break?
Dogecoin was trading between $0.0925 and $0.09173 with the price stabilizing around $0.0925.
The immediate $0.09443 resistance caps the current range. A move above this level could expand today’s trading activity.
Past historical price movements coincide with a number of trend support res
CryptoNewsLand2h ago
