
Key Takeaways
-
XRP is under short-term pressure as broader crypto market weakness triggers fresh liquidations.
-
The weekly chart shows XRP trading inside a right-angled ascending broadening wedge, a structure often linked with high-volatility breakouts.
-
Price is currently testing a critical demand zone between $1.77 and $1.95, which has repeatedly absorbed selling pressure.
-
Holding this support keeps the bullish structure intact and raises the probability of accumulation.
-
A reclaim of the 50-week moving average near $2.44 could reignite upside momentum toward the $4.0+ resistance zone.
**XRP **is trading in the red as the broader cryptocurrency market remains under pressure over the past 48 hours. Risk sentiment has turned cautious once again, with Bitcoin (BTC) and Ethereum (ETH) both sliding nearly 2% in the last 24 hours. This move triggered more than $351 million in liquidations across the market, with long positions taking the brunt of the damage.
As volatility spreads, altcoins have also come under pressure, and XRP is no exception. The token is down around 2.6% at the time of writing. However, beyond the short-term weakness, XRP’s higher-timeframe chart is flashing signals that this pullback may be more than just another sell-off.
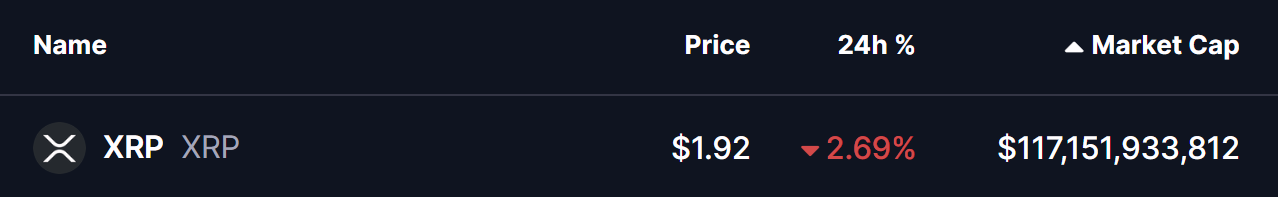
Source: Coinmarketcap
XRP Tests a Critical Demand Zone
On the weekly chart, XRP is trading within a right-angled ascending broadening wedge, a structure often associated with high volatility and decisive breakouts once price reaches key boundaries. After a powerful rally earlier in the cycle, XRP faced strong rejection near the upper resistance trendline around $3.66 in mid-2025. That rejection triggered a sharp correction, sending price down roughly 50%.
This decline has now brought XRP back into a major demand zone between $1.77 and $1.95. Historically, this area has acted as a strong defensive level throughout the wedge formation. Each time price has revisited this zone, selling pressure has been absorbed aggressively, leading to stabilization and rebound attempts.
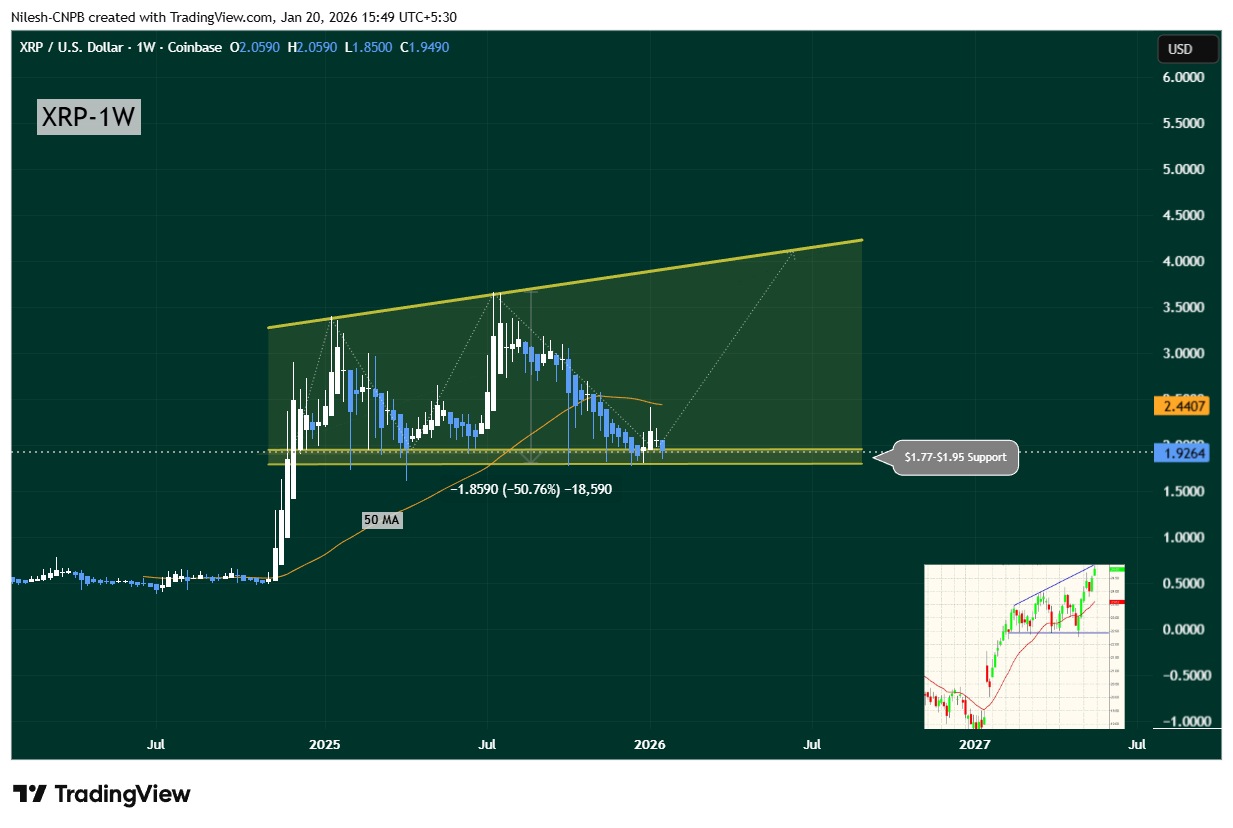
XRP Weekly Chart/Coinsprobe (Source: Tradingview)
The current reaction suggests buyers are once again stepping in, treating this region as a value area rather than a breakdown point. This makes the zone a key battlefield that could determine XRP’s medium-term direction.
What’s Next for XRP?
While price remains compressed near support, XRP is also trading below its 50-week moving average, which sits near $2.44. This moving average has turned into a key overhead resistance and represents the level bulls need to reclaim to shift momentum back in their favor.
If XRP can hold above the $1.77–$1.95 support zone and push back above the 50-week moving average, confidence could return quickly. Such a move would open the door for a recovery toward the upper resistance trendline of the wedge, with upside potential extending beyond the $4.0 region if a breakout materializes.
On the flip side, the bullish structure remains vulnerable. A decisive breakdown below $1.77 would weaken the wedge formation and expose XRP to further downside, invalidating the accumulation thesis.
Bottom Line
For now, XRP finds itself at a technically pivotal level. While broader market uncertainty continues to drive volatility, the weekly structure suggests this dip could be a consolidation or accumulation phase rather than the start of a new bearish trend.
The next few weekly closes will be critical. How XRP reacts around this support zone is likely to set the tone for its next major move — whether that’s a renewed push higher or another leg of downside before stability returns.
Disclaimer: The views and analysis presented in this article are for informational purposes only and reflect the author’s perspective, not financial advice. Technical patterns and indicators discussed are subject to market volatility and may or may not yield the anticipated results. Investors are advised to exercise caution, conduct independent research, and make decisions aligned with their individual risk tolerance.
About Author: Nilesh Hembade is the Founder and Lead Author of Coinsprobe, with over 5 years of experience in the cryptocurrency and blockchain industry. Since launching Coinsprobe in 2023, he has been providing daily, research-driven insights through in-depth market analysis, on-chain data, and technical research.
Disclaimer: The information on this page may come from third parties and does not represent the views or opinions of Gate. The content displayed on this page is for reference only and does not constitute any financial, investment, or legal advice. Gate does not guarantee the accuracy or completeness of the information and shall not be liable for any losses arising from the use of this information. Virtual asset investments carry high risks and are subject to significant price volatility. You may lose all of your invested principal. Please fully understand the relevant risks and make prudent decisions based on your own financial situation and risk tolerance. For details, please refer to
Disclaimer.
Related Articles
Evernorth Files S-4 Registration for $1 Billion SPAC Merger, Targeting Nasdaq Listing as XRP Treasury Company
XRP-focused crypto treasury firm Evernorth submitted a Form S-4 registration statement to the U.S. Securities and Exchange Commission (SEC) on March 18, 2026, advancing its proposed business combination with special purpose acquisition company Armada Acquisition Corp. II to go public on Nasdaq.
CryptopulseElite8m ago
XRP Today’s News: Goldman Sachs Holds 154 Million XRP in ETF, Institutional Buying Fails to Drive Up the Price
Goldman Sachs has become the largest public holder of XRP spot ETF with a position of approximately $154 million, but this institutional signal has yet to be reflected in the coin price, with XRP still hovering around $1.29. Technical analysis shows that the $1.50 support level is critical, and a breakthrough could push prices higher.
MarketWhisper1h ago
Bitcoin ETF Inflows for Seven Consecutive Days Set Half-Year Record, Scale Still Below 2025 Peak
US spot Bitcoin ETF sees seven consecutive days of inflows, marking the longest streak since the start of 2025. Cumulative inflows over the past three weeks reached $2.2 billion, accounting for 79% of total crypto inflows. Although market sentiment has improved somewhat, it still falls short compared to the 2025 peak, with analysis suggesting a recovery in market demand rather than the onset of a bull cycle. Solana ETF showed outstanding performance this week, while Ethereum ETF continues to face net outflow pressure.
MarketWhisper1h ago
Why Bitcoin, Ethereum & XRP Prices Are Dropping—Is This a Bull Trap? - BTC Hunts
The post Why Bitcoin, Ethereum & XRP Prices Are Dropping—Is This a Bull Trap? appeared first on Coinpedia Fintech News
The crypto market has entered a corrective phase, with Bitcoin (BTC) price dropping to around $71,500, down nearly 3.33%, while Ethereum (ETH) price has also slipped
BTCHUNTS3h ago
