 Trusted Editorial content, reviewed by leading industry experts and seasoned editors. Ad Disclosure
Bitcoin has slipped below the $90,000 psychological level, and bulls are now trying to defend the $88,000 mark to prevent a deeper correction. After days of heavy volatility across crypto markets, BTC is trading in a fragile zone where short-term sentiment can shift quickly, especially as traders react to macro uncertainty and weakening momentum. With price hovering near key on-chain levels, the next move could define whether this drop becomes a brief shakeout or the start of another leg lower.
Trusted Editorial content, reviewed by leading industry experts and seasoned editors. Ad Disclosure
Bitcoin has slipped below the $90,000 psychological level, and bulls are now trying to defend the $88,000 mark to prevent a deeper correction. After days of heavy volatility across crypto markets, BTC is trading in a fragile zone where short-term sentiment can shift quickly, especially as traders react to macro uncertainty and weakening momentum. With price hovering near key on-chain levels, the next move could define whether this drop becomes a brief shakeout or the start of another leg lower.
Related Reading: Bitcoin Recovers In January: Funding Divergence Points To A Spot-Driven MarketAnalyst Axel Adler highlighted that Bitcoin is currently testing one of its most important short-term “defense lines.” His Bitcoin Support and Resistance chart compares spot price with the realized cost basis of different short-term holder (STH) cohorts, turning these levels into dynamic support and resistance zones.
According to the data, BTC is trading right around the cost basis of the two freshest buyer groups: STH 0D-1D at roughly $89,800 and STH 1W-1M near $90,000. In other words, investors who entered the market over the past few weeks are sitting at breakeven, making this area highly sensitive.
Above current levels, resistance appears stacked. The 1M-3M cohort sits near $92,500 and is already underwater, meaning it may sell into rebounds, while the aggregated STH realized price around $99,300 remains a major ceiling.
STH MVRV Near a Statistical Extreme
Adler adds that another key metric reinforcing this fragile setup is Short-Term Holder MVRV (STH MVRV), which measures the ratio between Bitcoin’s market price and the cost basis of short-term holders. In simple terms, when STH MVRV drops below 1.0, it signals that this cohort is, on average, holding unrealized losses and is increasingly vulnerable to panic-driven selling.
According to Adler, current STH MVRV stands at 0.897, meaning short-term holders are clearly underwater. More importantly, the metric is approaching the lower boundary of its 155-day statistical range, where the Mean minus one standard deviation sits near 0.875. With only around 2.5% remaining before reaching that statistical minimum, Bitcoin is entering a zone that historically aligns with market exhaustion and local bottom formation.
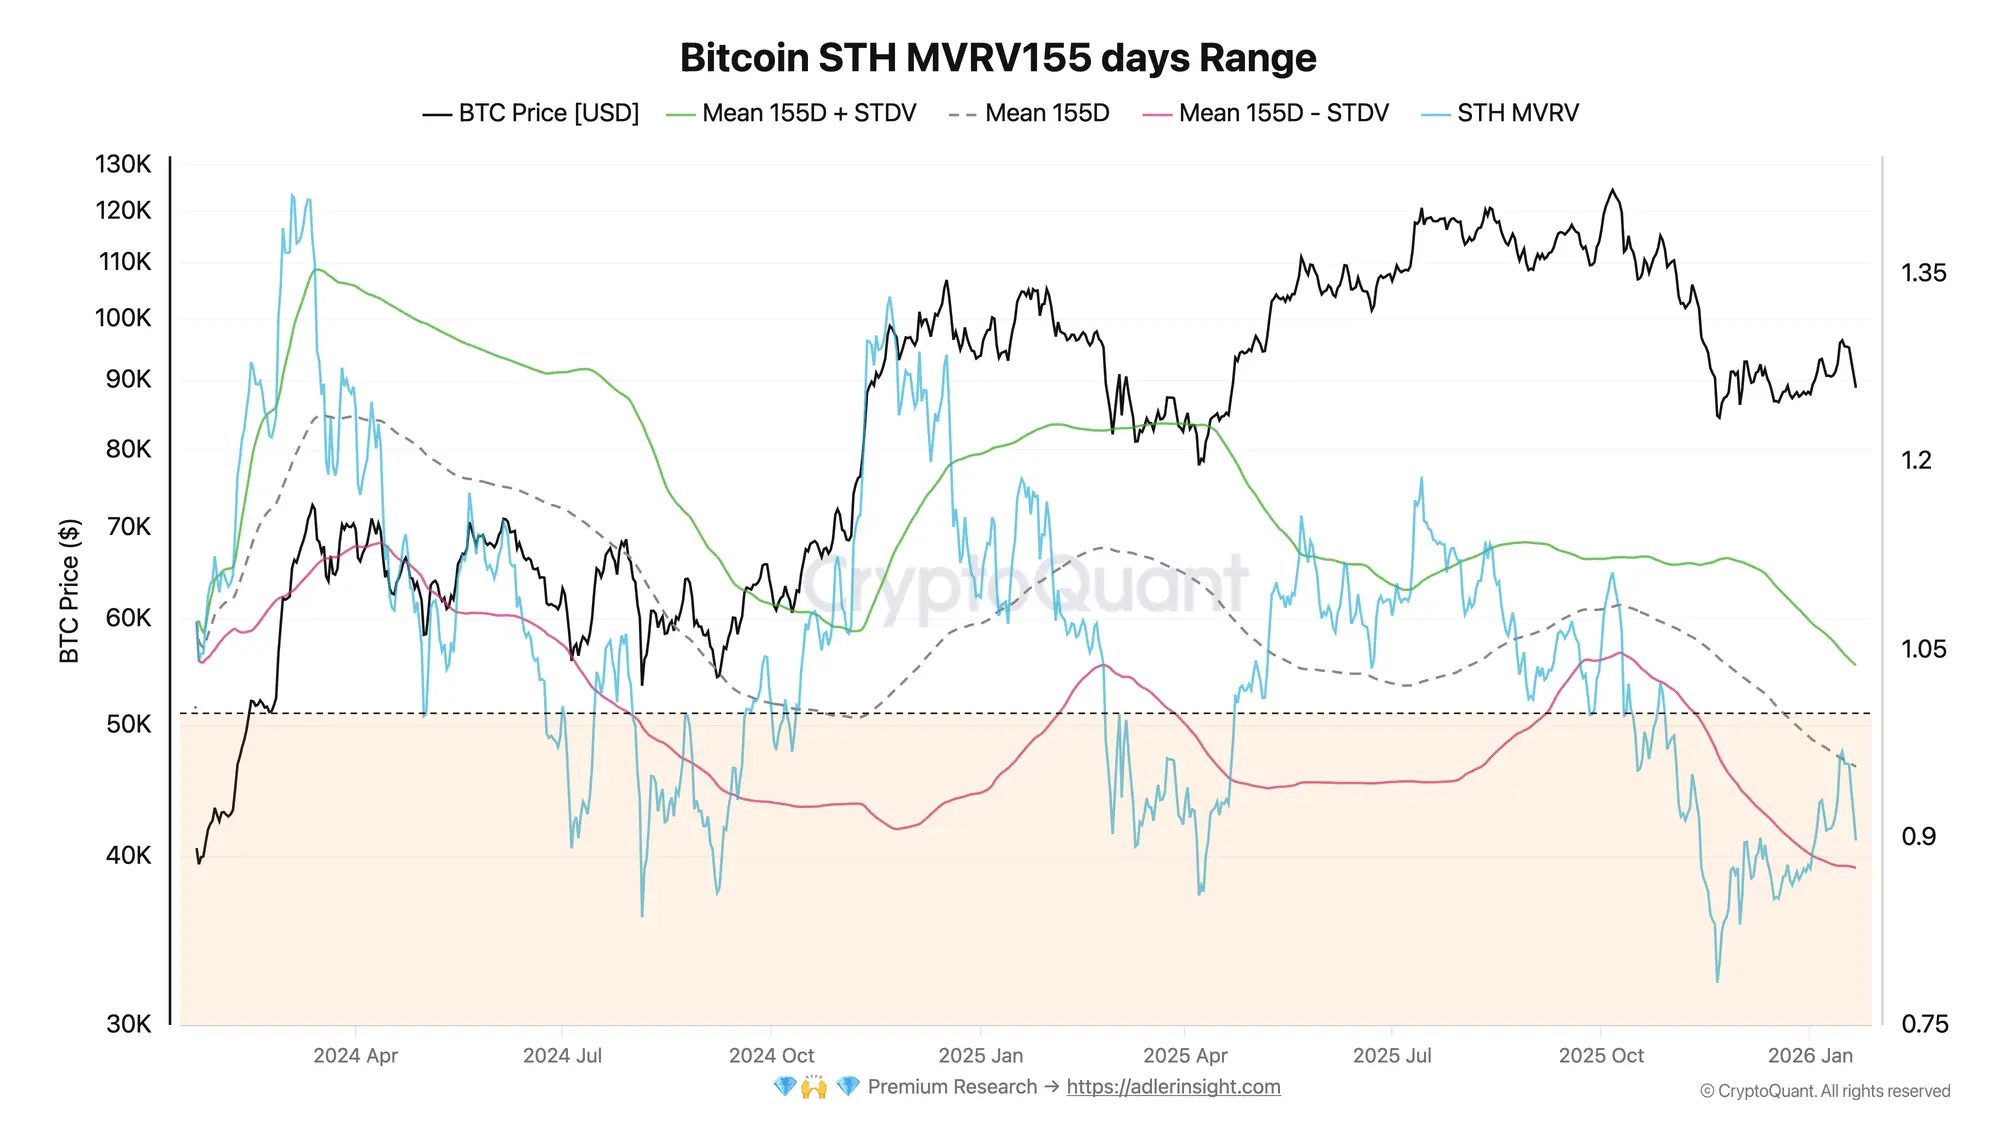 Bitcoin STH MVRV 155 days Range | Source: CryptoQuantAdler notes that in many past observations, price stabilization occurred when the metric touched or approached this lower band, as buyers stepped in and selling pressure weakened. However, the market remains at a critical decision point. A clean break below 0.875 would signal extreme oversold conditions and raise the risk of short-term holder capitulation.
Together, both charts frame the same battlefield. The $89.8K–$90K region is the key defense zone for fresh buyers, while $92.5K now acts as resistance. With MVRV pressing toward a statistical extreme, Bitcoin is approaching a make-or-break moment between stabilization and deeper downside.
Related Reading: Bitcoin’s Pullback Feels Brutal, But History Says It Could Drag On For Months
Bitcoin Bears Pressure Key Support Zones
Bitcoin (BTC) is facing renewed downside pressure after failing to reclaim the $90,000 region, with the latest pullback pushing price toward the $88,600 area. The 3-day chart shows BTC slipping back into the lower part of its recent range, reflecting a fragile market structure where rallies are being sold and buyers remain hesitant to step in aggressively.
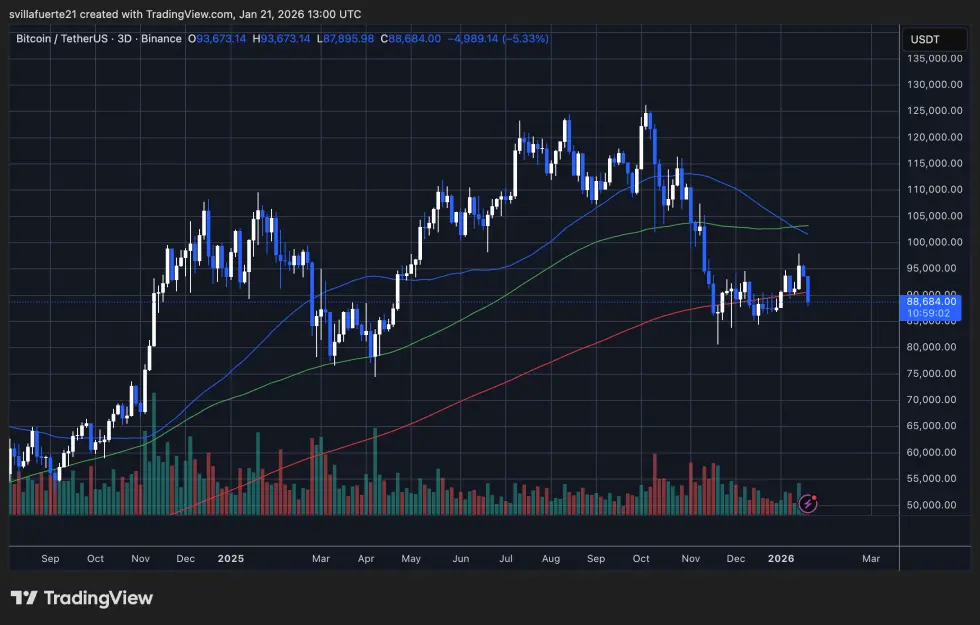 BTC consolidates around critical demand level | Source: BTCUSDT chart on TradingView
From a trend perspective, BTC is trading below its key moving averages, with the faster lines curling downward and acting as dynamic resistance. The most notable barrier sits around the $100,000–$105,000 zone, where the broader trend indicators remain overhead and signal that the market is still in recovery mode rather than a confirmed uptrend. Even the recent bounce attempts have struggled to sustain momentum, highlighting that demand has not returned with enough force to absorb selling pressure.
BTC consolidates around critical demand level | Source: BTCUSDT chart on TradingView
From a trend perspective, BTC is trading below its key moving averages, with the faster lines curling downward and acting as dynamic resistance. The most notable barrier sits around the $100,000–$105,000 zone, where the broader trend indicators remain overhead and signal that the market is still in recovery mode rather than a confirmed uptrend. Even the recent bounce attempts have struggled to sustain momentum, highlighting that demand has not returned with enough force to absorb selling pressure.
Related Reading: Bitcoin Cycle Isn’t Over: Realized Price Bands Show Holder Stress Above Key Levels
At the same time, BTC continues to hold above the red long-term moving average, which is still rising and represents the broader bull market foundation. This keeps the larger structure intact, but the price action suggests that bulls must defend the $88,000–$90,000 area to prevent further weakness.
If BTC stabilizes and reclaims $90K, it could open the door for a push back into the mid-$90K range. However, if selling accelerates below $88K, the market risks revisiting deeper support levels from the late-2025 consolidation.
Featured image from ChatGPT, chart from TradingView.com
![]() Editorial Process for bitcoinist is centered on delivering thoroughly researched, accurate, and unbiased content. We uphold strict sourcing standards, and each page undergoes diligent review by our team of top technology experts and seasoned editors. This process ensures the integrity, relevance, and value of our content for our readers.
Editorial Process for bitcoinist is centered on delivering thoroughly researched, accurate, and unbiased content. We uphold strict sourcing standards, and each page undergoes diligent review by our team of top technology experts and seasoned editors. This process ensures the integrity, relevance, and value of our content for our readers.
Disclaimer: The information on this page may come from third parties and does not represent the views or opinions of Gate. The content displayed on this page is for reference only and does not constitute any financial, investment, or legal advice. Gate does not guarantee the accuracy or completeness of the information and shall not be liable for any losses arising from the use of this information. Virtual asset investments carry high risks and are subject to significant price volatility. You may lose all of your invested principal. Please fully understand the relevant risks and make prudent decisions based on your own financial situation and risk tolerance. For details, please refer to
Disclaimer.
Related Articles
Complete Guide to Using Bitcoin Blockchain Explorer
Bitcoin is developed on the concept of transparency, permitting everyone to verify transfers directly via the public ledger. One of the convenient methods to check this transparency is via a blockchain explorer, an instrument that lets users view transfer details, network activity, and wallet
BlockChainReporter21m ago
Michael Saylor’s Strategy Buys 22,337 BTC in $1.57B Weekly Purchase
Strategy has acquired 22,337 BTC for $1.57 billion, raising its total to 761,068 Bitcoin. This marks the firm's 12th consecutive week of accumulation, funded through the sale of STRC and MSTR shares.
CryptoFrontNews22m ago
Bitcoin Everlight: Why Skip Dogecoin for 21% APY Nodes?
Dogecoin has one of the most recognizable brands in the entire crypto industry. It has celebrity endorsements, a decade of community loyalty, and a market cap that most projects would envy. What it doesn’t have is a native way to earn passive income from holding it.
That’s not an opinion — it’s a t
BlockChainReporter24m ago
Bitcoin Treasury Company Genius Group Founder Cumulatively Repurchases 5.5 Million Company Shares, Total Investment of $2.9 Million
Gate News reports that on March 17, NYSE American-listed bitcoin treasury company Genius Group disclosed that the company's founder and CEO Roger Hamilton repurchased 300,000 shares of the company at an average price of $0.37 per share in the open market last week. To date, Roger Hamilton has spent $2.9 million across seven separate transactions to repurchase a total of 5.5 million company shares.
GateNews52m ago
BTC broke through $74,000 this week, with short-term holders' profits surging to $18.4 million per hour.
Gate News reported that on March 17, according to Glassnode data, Bitcoin price made a modest breakthrough above $74,000 this week, with short-term holder realized profit (STH-Realized Profit, 12-hour simple moving average) surging to $18.4 million per hour. This is consistent with the pattern observed in February: short-term holders continuously drain momentum from each bounce at the $70,000 level, absorbing upward momentum before any real breakout can form.
GateNews57m ago
