
Key Takeaways:
-
Ondo (ONDO) is trading near a critical support zone around $0.32 after a sharp market-wide sell-off.
-
The daily chart shows a right-angled descending broadening wedge, a pattern often linked to potential bullish reversals.
-
Buyers are defending the lower wedge boundary, suggesting selling pressure may be weakening.
-
The 100-day moving average near $0.53 remains a major resistance that must be reclaimed for trend reversal confirmation.
-
A successful rebound could open the door for a recovery toward the $1.10–$1.17 resistance zone, while a breakdown below $0.32 would invalidate the bullish setup.
The real-world asset (RWA) token Ondo (ONDO) is trading under pressure near $0.35, extending its short-term downtrend amid a broader crypto market sell-off. The latest wave of weakness follows escalating US–EU trade tensions, which sparked over $851 million in long liquidations, dragging major assets like Bitcoin (BTC) and Ethereum (ETH) down by roughly 2.5% and 4.5%, respectively, over the past 24 hours.
ONDO itself is down 5.98% at the time of writing. However, despite the bearish momentum, the daily chart suggests price is approaching a technically important zone where a potential rebound setup could begin to form.
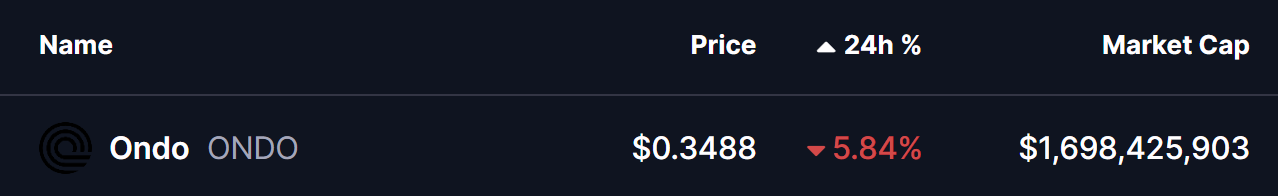
Source: Coinmarketcap
Right-Angled Descending Broadening Wedge in Focus
From a technical perspective, Ondo’s daily chart is carving out a right-angled descending broadening wedge, a pattern that often appears during extended corrective phases and can precede bullish reversals if support holds.
This structure has been developing since ONDO’s rejection from the neckline resistance zone around $1.00–$1.17 back in September 2025. Since then, price has continued to print lower highs while gradually expanding volatility, pushing ONDO down toward the lower boundary of the wedge near $0.32.
Notably, selling pressure appears to be easing near this zone. Buyers have stepped in to defend the level, with ONDO currently hovering slightly above it around $0.348 — a sign that demand may be emerging after weeks of sustained downside.
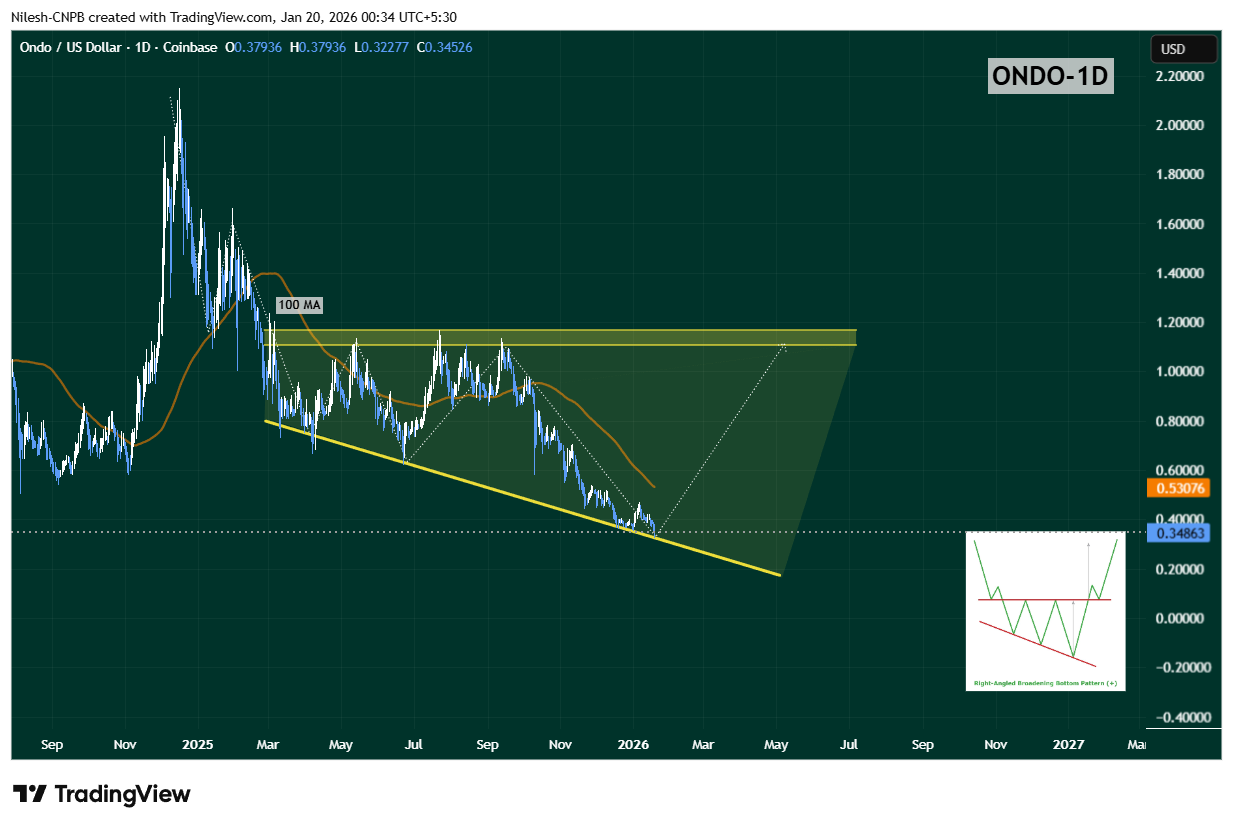
Ondo (ONDO) Daily Chart/Coinsprobe (Source: Tradingview)
While the lower wedge support is holding for now, upside momentum remains constrained. The 100-day moving average, currently positioned near $0.53, has flipped into strong overhead resistance. Each prior rally attempt has stalled below this level, reinforcing its importance as a confirmation point for any meaningful trend reversal.
Until ONDO can reclaim this moving average, any bounce should be viewed as a relief rally within a broader consolidation, rather than a confirmed rebound.
What’s Next for ONDO?
As long as ONDO continues to defend the $0.32 support zone, the right-angled descending broadening wedge remains technically valid. Sustained holding above this level keeps the door open for a rebound attempt, particularly if price begins forming higher daily or weekly closes.
A successful reclaim of the 50-day moving average, followed by a breakout above the 100-day MA, would mark a clear shift in momentum. If that scenario unfolds, ONDO could gradually work its way back toward the upper boundary of the wedge, which currently aligns near the $1.10–$1.17 region — a level that would represent a significant recovery from current prices.
On the flip side, a decisive breakdown below $0.32 would invalidate the bullish wedge structure and likely expose ONDO to another leg of downside or prolonged consolidation.
Bottom Line
Ondo is currently sitting at a critical technical crossroads. While broader market sentiment remains fragile, the chart suggests ONDO is testing a zone where seller exhaustion could give way to a bounce. The next few sessions will be crucial. How price reacts around the lower wedge support will likely determine whether ONDO can stage a meaningful rebound — or whether bears retain control for longer.
Disclaimer: The views and analysis presented in this article are for informational purposes only and reflect the author’s perspective, not financial advice. Technical patterns and indicators discussed are subject to market volatility and may or may not yield the anticipated results. Investors are advised to exercise caution, conduct independent research, and make decisions aligned with their individual risk tolerance.
About Author: Nilesh Hembade is the Founder and Lead Author of Coinsprobe, with over 5 years of experience in the cryptocurrency and blockchain industry. Since launching Coinsprobe in 2023, he has been providing daily, research-driven insights through in-depth market analysis, on-chain data, and technical research.
Disclaimer: The information on this page may come from third parties and does not represent the views or opinions of Gate. The content displayed on this page is for reference only and does not constitute any financial, investment, or legal advice. Gate does not guarantee the accuracy or completeness of the information and shall not be liable for any losses arising from the use of this information. Virtual asset investments carry high risks and are subject to significant price volatility. You may lose all of your invested principal. Please fully understand the relevant risks and make prudent decisions based on your own financial situation and risk tolerance. For details, please refer to
Disclaimer.
Related Articles
Bitcoin Uptrend Likely by Late 2026, Says Scaramucci
The latest downturn in Bitcoin has sparked fresh debate across the crypto market. However, according to Anthony Scaramucci, the explanation may be far less surprising than many expect. The SkyBridge Capital managing partner believes the current pullback is simply part of Bitcoin’s long-standing
Coinfomania35m ago
Panic sentiment surges, "hedging costs" reach new highs! VanEck: Bitcoin may be approaching a reversal point
VanEck's research shows that the Bitcoin market is currently in a state of extreme anxiety. Despite rising hedging costs, traders are actively seeking downside protection. The report points out that while leverage and volatility have decreased, the options market is displaying panic signals, with put premiums reaching new highs. However, historical data suggests that extreme panic often precedes a rebound, and significant market turning points may emerge in the future.
区块客39m ago
TRUMP Token May Test Historical Lows Again? $70 Million Sell Pressure Incoming, $3 Level in Jeopardy
Trump token TRUMP has continued to decline recently, with the current price at $3.21, down 1.32% intraday and approaching its historical low of $2.705. On-chain data shows selling pressure has not been fully released, with significant major capital outflows. Technical analysis indicates that if the trend continues, the price could decline to $2.71, with $3.00 serving as psychological support. Market sentiment has turned cautious.
GateNews41m ago
MICA Daily | Why Have Stocks Fallen While Crypto Has Risen Recently? Analyzing the Truth Behind the Decoupling
Since October 2025, the positive correlation between Bitcoin and the S&P 500 Index has significantly weakened, entering a decoupling phase. This change stems from large-scale liquidation events, depressed market liquidity, and reduced risk appetite among traders. Meanwhile, ETF outflows and geopolitical tensions have also impacted Bitcoin's performance, demonstrating that its potential as a safe-haven asset is gradually increasing as deleveraging comes to an end.
区块客42m ago
Bitcoin Rebound Timeline Exposed: Scaramucci Says Q4 May Launch New Bull Market, $1 Million Target Unchanged
Under geopolitical risks and macroeconomic pressures, Bitcoin's price has broken below $68,000. Anthony Scaramucci, founder of SkyBridge Capital, believes this represents a typical cyclical pullback and anticipates Bitcoin may rally again in 2026. Despite short-term market risks, long-term bullish sentiment remains solid.
GateNews43m ago
Bitcoin Potentially Dips to $62,000? Mega Whales Counter-Trend Accumulation Hits One-Year High, Long-Short Battle Intensifies
Bitcoin broke below the head and shoulders neckline on March 23rd, with prices sliding to around $68,100. The downside target is expected at $62,200. Despite coin holders increasing positions and RSI forming a divergence signal, the market is still facing selling pressure. $69,500 serves as a key support level, and future trends will depend on the battle over key price levels.
GateNews46m ago
