
**Date: **Mon, Jan 05, 2026 | 05:26 AM GMT
As 2026 kicks off, the broader cryptocurrency market is showing renewed stability. Ethereum (ETH) is up nearly 4% on the week, and momentum is gradually spreading across major altcoins — including the decentralized exchange token Aster (ASTER).
While ASTER is also posting over 4% weekly gains, the more important story is unfolding beneath the surface. Recent price action suggests a meaningful structural shift may be developing — one that could mark the early stages of a bullish continuation if key technical levels are reclaimed.
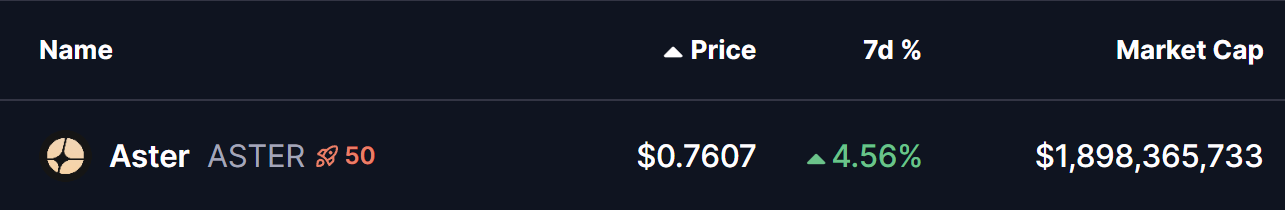
Source: Coinmarketcap
Rounding Bottom in Play
On the daily timeframe, **Aster **appears to be forming a rounding bottom pattern, a classic bullish reversal structure that typically develops after a prolonged corrective phase. This pattern reflects a gradual transition from aggressive selling to steady accumulation, as downside momentum fades and buyers slowly regain confidence.
The setup began after ASTER faced strong rejection near the $1.35–$1.40 neckline resistance zone, triggering a sharp decline through late November and December. That downside move eventually found strong demand near the $0.6546 support level, which has since acted as a critical base. Multiple defenses of this zone prevented further downside and helped establish a stable foundation for a potential trend reversal.
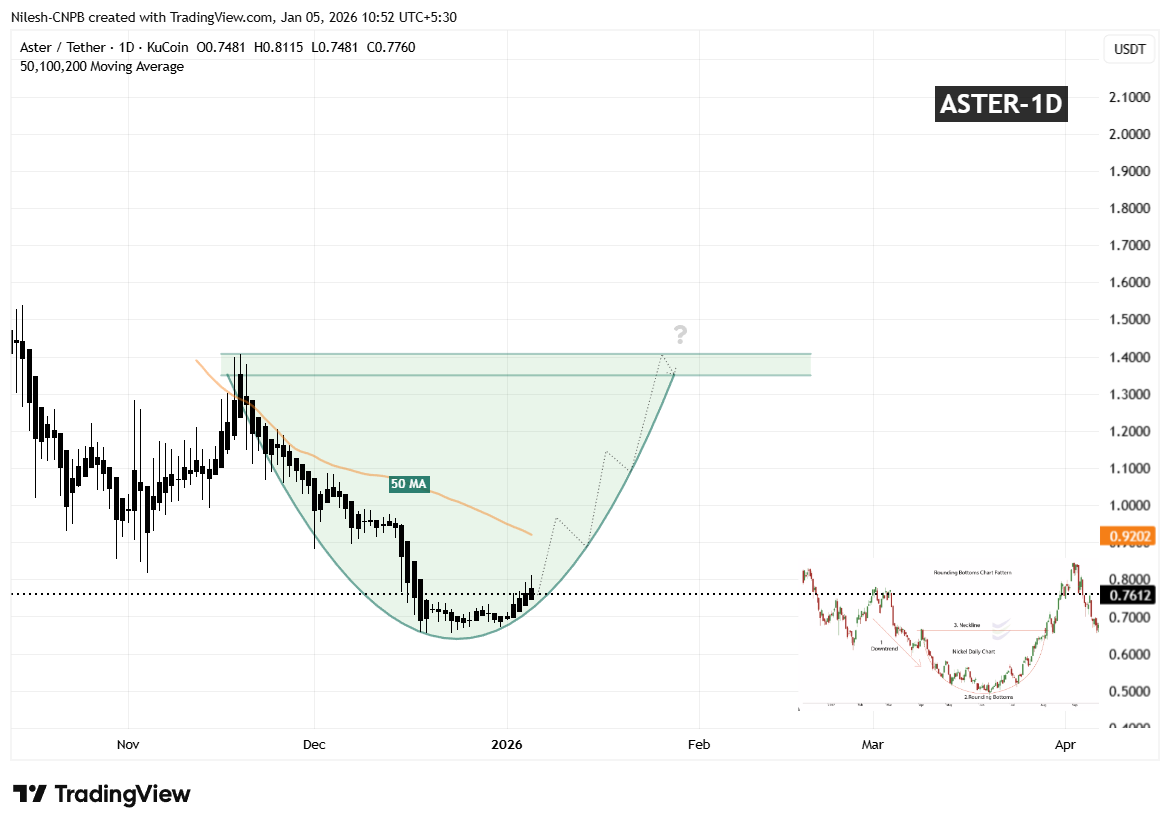
Aster (ASTER) Daily Chart/Coinsprobe (Source: Tradingview)
Since carving out that bottom, ASTER has started to curve higher in a smooth, rounded fashion — closely matching the textbook structure of a developing rounding bottom. The recent stabilization above the $0.76 region further supports the view that selling pressure is weakening and accumulation may be underway.
A key technical level now comes into focus: the 50-day moving average, currently hovering near $0.9202. This moving average has acted as dynamic resistance throughout the recovery phase, repeatedly capping upside attempts.
What’s Next for ASTER?
For the rounding bottom structure to gain confirmation, ASTER needs to reclaim the $0.9202 region and establish acceptance above the 50-day moving average. A sustained move above this zone would signal that buyers are regaining control after months of corrective price action.
Beyond that, the most significant technical barrier remains the $1.35–$1.40 neckline resistance. A clean and decisive breakout above this area would validate the entire reversal pattern and could open the door for a broader bullish expansion phase, with momentum traders and sidelined participants likely re-entering the market.
Until those levels are reclaimed, the pattern remains in development. Short-term consolidation or minor pullbacks remain possible if ASTER struggles near the 50-day MA. However, as long as price continues to form higher lows and holds above the established rounding base, the broader bottoming structure remains intact and constructive.
Disclaimer: The views and analysis presented in this article are for informational purposes only and reflect the author’s perspective, not financial advice. Technical patterns and indicators discussed are subject to market volatility and may or may not yield the anticipated results. Investors are advised to exercise caution, conduct independent research, and make decisions aligned with their individual risk tolerance.
About Author: Nilesh Hembade is the Founder and Lead Author of Coinsprobe, with over 5 years of experience in the cryptocurrency and blockchain industry. Since launching Coinsprobe in 2023, he has been providing daily, research-driven insights through in-depth market analysis, on-chain data, and technical research.
Disclaimer: The information on this page may come from third parties and does not represent the views or opinions of Gate. The content displayed on this page is for reference only and does not constitute any financial, investment, or legal advice. Gate does not guarantee the accuracy or completeness of the information and shall not be liable for any losses arising from the use of this information. Virtual asset investments carry high risks and are subject to significant price volatility. You may lose all of your invested principal. Please fully understand the relevant risks and make prudent decisions based on your own financial situation and risk tolerance. For details, please refer to
Disclaimer.
Related Articles
Dogecoin Sees Rising Long Bets While Price Stays Under Pressure
Dogecoin's long positioning increases as traders expect a rebound, yet significant short positions and declining trading volume suppress price movement. The market lacks direction, showing a sideways to slightly bearish outlook as the price struggles to gain momentum.
CryptoNewsLand46m ago
Dogecoin Eyes Breakout as Bollinger Bands Signal Price Shift
Key Insights:
Dogecoin trades near resistance as Bollinger Bands tighten, signaling reduced volatility and an increasing likelihood of a sharp directional price movement soon.
Declining trading volume reflects market hesitation, yet reduced selling pressure may still support upward
CryptoNewsLand51m ago
PEPE Price Holds Bearish Structure as Rebound Signal Emerges
Key Insights
PEPE remains in a clear downtrend, with persistent lower highs and continued selling pressure keeping the price near key support levels around $0.00000330.
The TD Sequential indicator signals a possible rebound after an extended decline, suggesting a move toward 0.0000050 if
CryptoNewsLand1h ago
Cardano Holds Key Support as Whale Activity Signals Shift
Key Insights:
Whale accumulation increased steadily since March, with large holders absorbing supply near lows while retail activity remained subdued during weak price action phases.
Stablecoin liquidity on Cardano doubled year over year, strengthening market depth and supporting stronger
CryptoNewsLand1h ago
Chainlink Price Holds Steady as $9.75 Resistance Draws Focus
Key Insights
Chainlink trades within a defined range as a neutral RSI and steady volume create conditions for a potential breakout once momentum strengthens in the coming sessions.
Resistance at $8.89 remains critical as a confirmed move above this level could push the price toward the
CryptoNewsLand1h ago
ETH 15-minute pullback of 1.00%: Large capital selling and leveraged derivatives amplify short-term volatility
2026-04-06 16:45 to 2026-04-06 17:00 (UTC), ETH saw a brief 1.00% drop within 15 minutes; the price fell from 2168.6 USDT to 2140.3 USDT, with a swing of 1.31%. This round of abnormal price movement has drawn market attention, with heightened short-term volatility and a corresponding increase in trading volume.
The main driver behind this move is on-chain data showing that large ETH transfers of more than $10M per transaction were concentrated into a certain major exchange; the related net inflow of funds reached as high as 6,617.12 ETH. After the funds arrived,
GateNews2h ago
