
**Date: **Mon, Jan 05, 2026 | 07:55 AM GMT
As 2026 kicks off, the broader cryptocurrency market is showing renewed stability. Ethereum (ETH) is up around 4% on the week, and improving sentiment is gradually spreading across major altcoins — including Ethena (ENA).
ENA has already surged more than 14% on a weekly basis, but the more important development is unfolding beneath the surface. While short-term strength is encouraging, the bigger story lies in the structure forming on the chart. Recent price action suggests a meaningful shift in market behavior — one that could mark the early stages of a bullish continuation if key resistance levels are reclaimed.
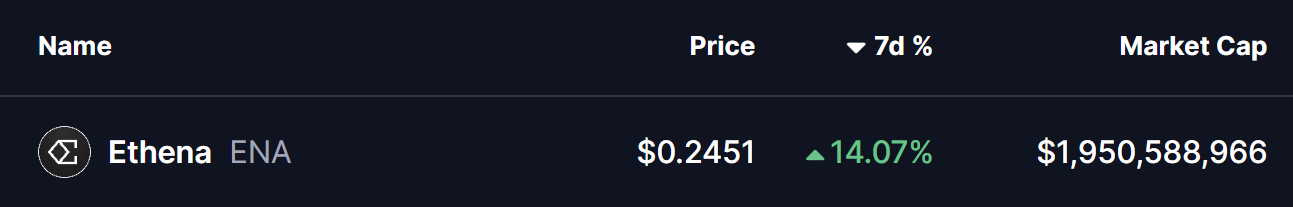
Source: Coinmarketcap
Rounding Bottom in Play
On the daily timeframe, ENA appears to be forming a rounding bottom pattern, a classic bullish reversal structure that typically develops after a prolonged corrective phase.
The setup began after ENA faced a firm rejection near the $0.3028–$0.2837 resistance zone late last month. That rejection triggered a sharp decline, dragging price down toward the $0.1935 area. Importantly, sellers failed to push price meaningfully lower from there, and strong demand emerged at those levels. Over time, ENA stabilized, volatility compressed, and price began to curl higher — completing the rounded base structure.
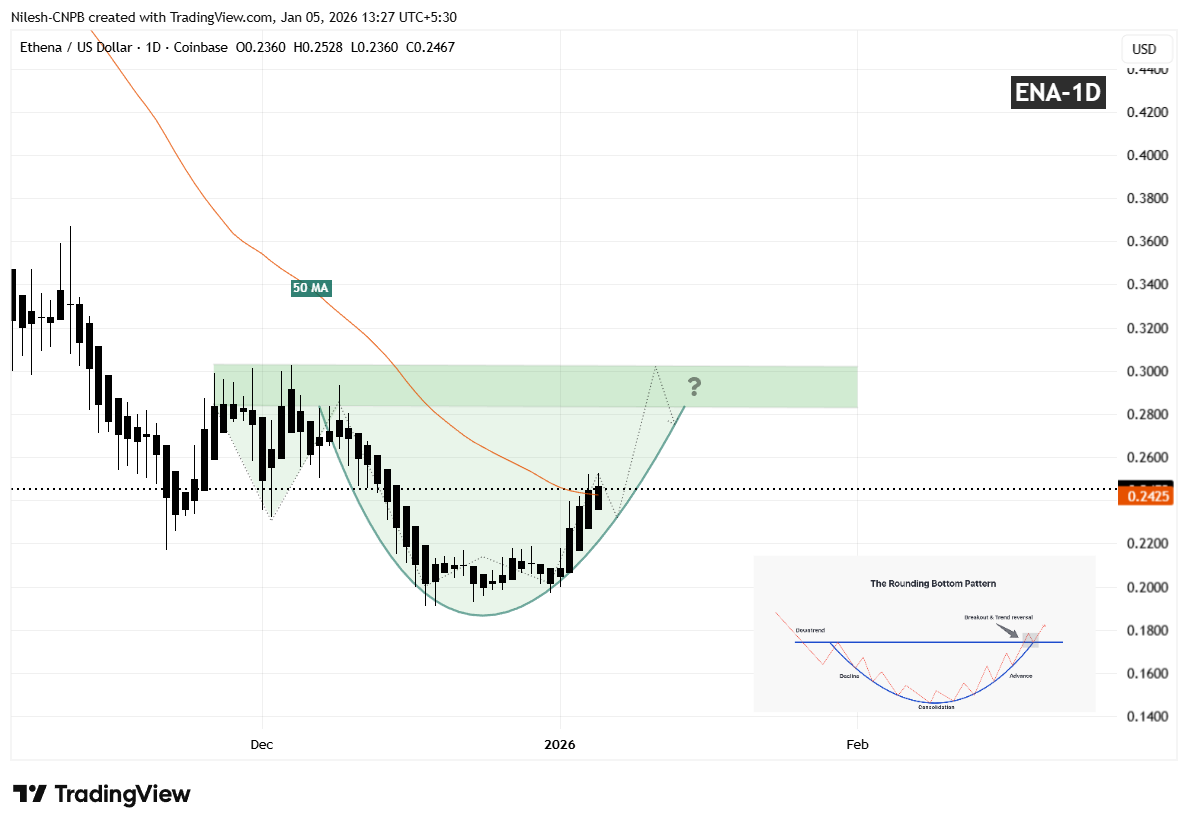
Ethena (ENA) Daily Chart/Coinsprobe (Source: Tradingview)
Since carving out that bottom, ENA has started to move higher in a smooth, rounded fashion, closely matching the textbook characteristics of a developing rounding bottom. The recent recovery has also brought price back toward the 50-day moving average near $0.2451, a level that previously acted as resistance and is now being tested as potential support.
What’s Next for ENA?
If ENA continues to hold above the 50-day MA, that level could act as a solid short-term base for further upside attempts. A clean and decisive breakout above the $0.3028–$0.2837 resistance zone, followed by sustained acceptance above it, would validate the entire reversal pattern and likely open the door for a broader bullish expansion phase.
Until such a breakout occurs, the pattern remains in development. Short-term consolidation or shallow pullbacks remain possible as price digests recent gains. However, as long as ENA continues to form higher lows above the established base, the broader bottoming structure remains intact and constructive.
For now, the chart suggests ENA is approaching a critical confirmation phase — one that could determine whether this recovery evolves into a sustained bullish trend as the new year unfolds.
Disclaimer: The views and analysis presented in this article are for informational purposes only and reflect the author’s perspective, not financial advice. Technical patterns and indicators discussed are subject to market volatility and may or may not yield the anticipated results. Investors are advised to exercise caution, conduct independent research, and make decisions aligned with their individual risk tolerance.
About Author: Nilesh Hembade is the Founder and Lead Author of Coinsprobe, with over 5 years of experience in the cryptocurrency and blockchain industry. Since launching Coinsprobe in 2023, he has been providing daily, research-driven insights through in-depth market analysis, on-chain data, and technical research.
Disclaimer: The information on this page may come from third parties and does not represent the views or opinions of Gate. The content displayed on this page is for reference only and does not constitute any financial, investment, or legal advice. Gate does not guarantee the accuracy or completeness of the information and shall not be liable for any losses arising from the use of this information. Virtual asset investments carry high risks and are subject to significant price volatility. You may lose all of your invested principal. Please fully understand the relevant risks and make prudent decisions based on your own financial situation and risk tolerance. For details, please refer to
Disclaimer.
Related Articles
Gold Price Dip Deepens – Is Smart Money Forcing the Market Lower?
Gold prices just took a nosedive, and people are trying to figure out why. Sure, markets move fast. But something about this drop feels off.
A trader named Wimar.X pointed out that hedge funds might be behind it. Here is the kicker. The CFTC data shows that hedge funds opened new short
CaptainAltcoin34m ago
'How Did You Manage That?': Peter Schiff Trolls Michael Saylor Over 4.5% Bitcoin Loss and $44 Billion Plans - U.Today
Michael Saylor continues to invest heavily in Bitcoin, purchasing $76.6 million worth despite facing criticism from Peter Schiff about recent losses. Saylor aims to acquire one million BTC, supported by a new $44.1 billion funding plan, while Schiff highlights the ongoing portfolio drawdown.
UToday1h ago
Cardano (ADA) Price Reclaims $0.26 as Volume Rockets 60% - U.Today
Cardano (ADA) has recovered to $0.26, up 3% with a 60% increase in trading volume. While analysts caution it remains range-bound, historical data suggests a potential bullish close in March, driven by market trends and DeFi growth.
UToday1h ago
Aster (ASTER) Price Breakout Fails After 35-Day Consolidation – What Happens Next?
The ASTER price has been consolidating for over a month, fluctuating without significant movement. A failed breakout led to a loss of key support at $0.68, indicating a bearish trend. The focus now is on whether it can recover above $0.68 to regain stability.
CaptainAltcoin1h ago
Bitcoin Decouples From S&P 500 as Retail Demand Weakens
Bitcoin retail activity has decreased by 10%, the lowest since January 2025, indicating weaker market participation. The advent of ETFs has shifted retail access off-chain, while Bitcoin has diverged from the S&P 500, marking its longest decoupling since 2020 amid a correction phase.
CryptoFrontNews2h ago
Bitcoin Is Experiencing Its Longest Decoupling From the S&P 500 Since 2020
Bitcoin's recent price movements have diverged from U.S. equities, marking the longest decoupling since 2020. Following significant liquidation, Bitcoin's decline contrasts with a more stable S&P 500, highlighting crypto's unique challenges amid broader market stress.
BlockChainReporter3h ago
