
**Date: **Tue, Jan 06, 2026 | 06:20 AM GMT
The broader cryptocurrency market continues to show fresh strength as 2026 unfolds. Bitcoin (BTC) and Ethereum (ETH) are both up more than 7% on the week, helping improve overall market sentiment. This renewed momentum is gradually spreading across major altcoins — including Pi Network (PI).
While PI has recorded a modest 5% gain over the past week, the more important development is taking shape on the chart. On lower timeframes, price action is compressing into a well-defined bullish structure, suggesting the token may be preparing for a meaningful breakout if resistance is reclaimed.
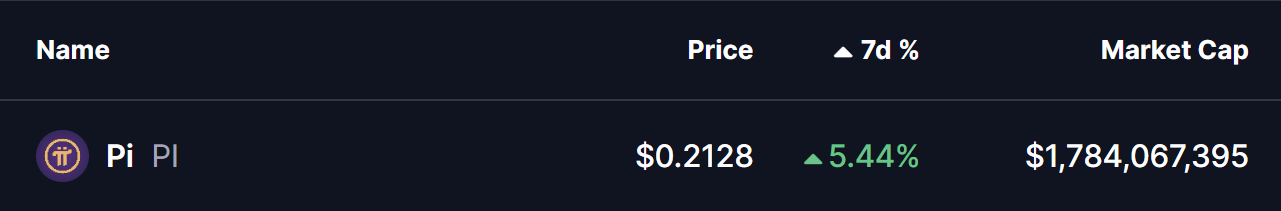
Source: Coinmarketcap
Ascending Triangle Taking Shape
On the 4-hour chart, Pi Network is forming a clear ascending triangle pattern. This structure is defined by a series of higher lows pressing steadily into a flat resistance zone, signaling persistent buying interest despite repeated rejections at the same level. Ascending triangles are widely considered bullish continuation patterns, particularly when they develop after an extended consolidation phase.
PI recently bounced cleanly from its rising support trendline, once again pushing price toward the upper boundary of the triangle around the $0.2129–$0.2160 region. The ability to repeatedly defend higher lows suggests that buyers remain in control and are willing to accumulate on dips rather than exit positions.
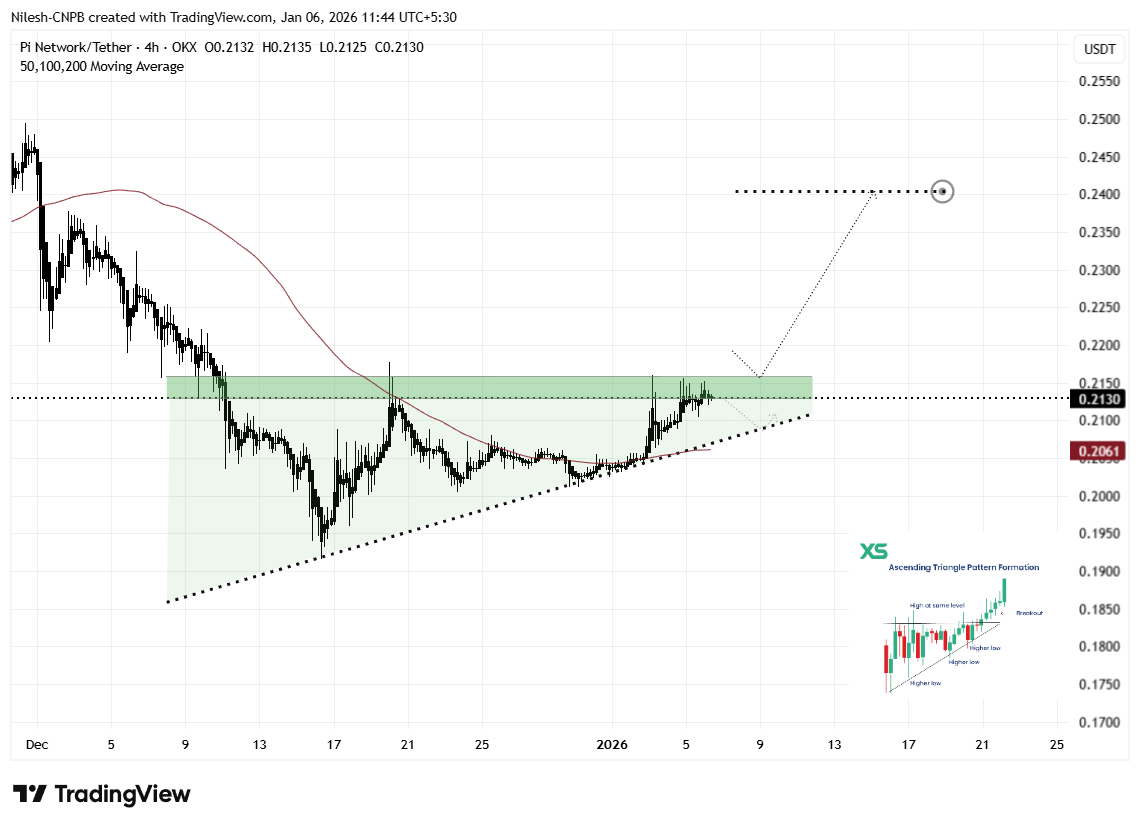
_ Pi Network (PI) 4H Chart/Coinsprobe (Source: Tradingview)_
Rather than signaling weakness, this sideways-to-higher price action reflects healthy consolidation. Volatility continues to compress, which often precedes a larger directional move as the market approaches a decision point.
What’s Next for PI?
From here, PI appears set for another test of the $0.2160 resistance zone. A decisive breakout above this level, followed by sustained acceptance and a successful retest as support, would confirm the ascending triangle structure and likely trigger a stronger bullish expansion.
Based on the measured move of the pattern, the technical upside projection points toward the $0.2404 area. This represents a potential upside of roughly 13% from current levels and also aligns with previous price structure, reinforcing the bullish case.
That said, caution remains important. If PI fails to break above resistance, price could rotate back toward the rising support trendline once again. As long as this ascending support holds, the broader bullish structure remains intact. A clear breakdown below the trendline, however, would invalidate the pattern and delay any breakout scenario.
For now, the combination of improving market sentiment and a tightening ascending triangle suggests Pi Network is approaching a critical inflection point — one that could define its next major move as the new year progresses.
Disclaimer: The views and analysis presented in this article are for informational purposes only and reflect the author’s perspective, not financial advice. Technical patterns and indicators discussed are subject to market volatility and may or may not yield the anticipated results. Investors are advised to exercise caution, conduct independent research, and make decisions aligned with their individual risk tolerance.
About Author: Nilesh Hembade is the Founder and Lead Author of Coinsprobe, with over 5 years of experience in the cryptocurrency and blockchain industry. Since launching Coinsprobe in 2023, he has been providing daily, research-driven insights through in-depth market analysis, on-chain data, and technical research.
Disclaimer: The information on this page may come from third parties and does not represent the views or opinions of Gate. The content displayed on this page is for reference only and does not constitute any financial, investment, or legal advice. Gate does not guarantee the accuracy or completeness of the information and shall not be liable for any losses arising from the use of this information. Virtual asset investments carry high risks and are subject to significant price volatility. You may lose all of your invested principal. Please fully understand the relevant risks and make prudent decisions based on your own financial situation and risk tolerance. For details, please refer to
Disclaimer.
Related Articles
Bitcoin has shown liquidity indicator resonance in the range of $65,000 to $66,000.
Gate News reported that on March 29, according to Coinkarma analysis, after Bitcoin's pullback from $76,000, the Overall Liquidity indicator and the ALT Resilient Index once again showed significant resonance in the $65,000-$66,000 range. Historical data shows that such resonance often corresponds to the formation of short-term bottoms.
GateNews11m ago
‘Extreme Fear’ Is Back but Bitcoin’s Price Recovery Depends on it: Santiment
Bitcoin dipped to a four-week low on Friday at $65,500 after it was rejected at $72,000 a few days earlier, which pushed the overall market sentiment back to ‘extreme fear’ territory.
However, the analysts from Santiment believe this could be the precise push BTC needs to stage a notable
CryptoPotato21m ago
CoinKarma: The liquidity and altcoin anti-dip indicators show a clear resonance, indicating short-term conditions for a rebound from the decline.
CoinKarma analysis indicates that after Bitcoin's pullback to $76,000, liquidity and altcoin resilience indicators are resonating, suggesting the possibility of a short-term rebound. When overall liquidity resonates with altcoin resilience indicators, it usually signals the formation of a short-term bottom.
BlockBeatNews21m ago
Dogecoin ETF Sees Zero Inflows as Traders Hold Through Dip
Key Insights
The Dogecoin ETF recorded zero inflows for eight straight days despite price volatility, signaling hesitation among institutional-style investors toward meme coin exposure products.
Traders accumulated millions of DOGE during price dips, indicating continued confidence in the
CryptoFrontNews51m ago
Why Is Chiliz (CHZ) Price Pumping?
Chiliz (CHZ) surged 15% within 24 hours, fueled by a 156% increase in trading volume to $160 million, breaking above key moving averages. Despite the lack of news catalysts, bullish momentum indicates potential further gains, contingent on maintaining high volume levels.
CaptainAltcoin1h ago
