
Date: Fri, Jan 02, 2026 | 10:54 AM GMT
The broader cryptocurrency market has started the new year with modest strength, as both Bitcoin (BTC) and Ethereum (ETH) trade slightly higher with gains of over 2%. This renewed stability across majors has helped improve overall sentiment, allowing several altcoins to regain momentum — including Aster (ASTER).
ASTER is currently trading around 4% higher on the day, but the more important development lies beneath the surface. On lower timeframes, price action is beginning to highlight a constructive bullish structure, suggesting that the token may be preparing for a meaningful breakout if the setup confirms.
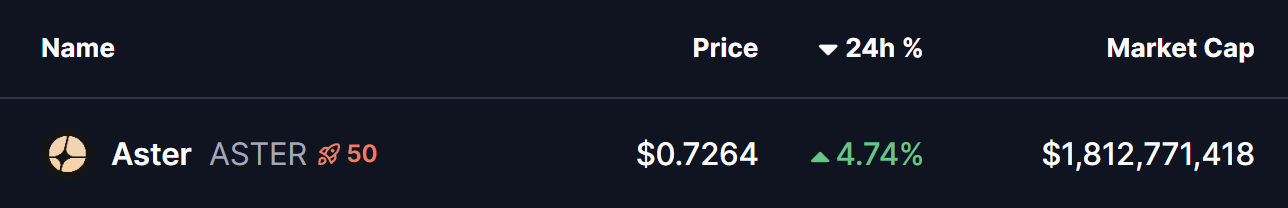
Source: Coinmarketcap
Ascending Triangle Structure Takes Shape
On the 4-hour chart, ASTER is forming a clear ascending triangle, defined by a series of higher lows pressing steadily against a horizontal resistance zone. This type of structure is widely regarded as a bullish continuation pattern, particularly when it develops during consolidation and shows consistent buyer accumulation at rising support levels.
ASTER recently faced rejection near the $0.7367 neckline resistance, which pushed price back toward its ascending support trendline around the $0.68 region. Importantly, each dip has been met with strong buying interest, preventing any deeper pullback and keeping the bullish structure intact. This behavior indicates that sellers are gradually losing control as buyers step in earlier on every retracement.
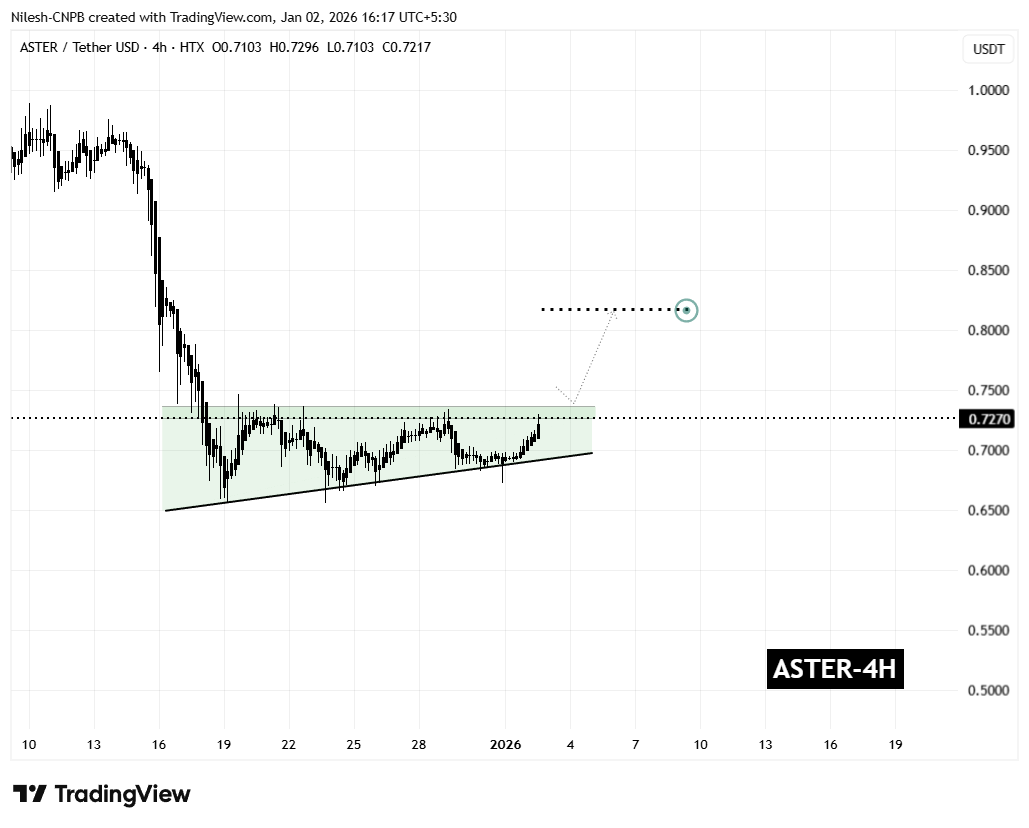
Aster (ASTER) 4H Chart/Coinsprobe (Source: Tradingview)
The latest rebound has once again carried ASTER toward the upper boundary of the triangle, reinforcing the idea that demand remains firm. Rather than signaling weakness, this sideways-to-higher price action reflects healthy consolidation as volatility tightens ahead of a potential breakout.
What’s Next for ASTER?
From here, ASTER appears to be preparing for another test of the $0.7367 resistance zone. A decisive breakout above this level, followed by a sustained close and a successful retest as support, would confirm the ascending triangle pattern and likely trigger a bullish expansion phase.
Based on the measured move of the formation, the technical upside projection points toward the $0.8178 region. This target represents a potential upside of roughly 12% from current levels and also aligns with previous price structure, adding further confidence to the bullish outlook.
That said, caution remains warranted. If ASTER fails to break above resistance, price could once again drift back toward the rising support trendline. As long as this trendline continues to hold, the broader bullish setup remains valid. A decisive breakdown below support, however, would invalidate the pattern and postpone any breakout scenario.
For now, the combination of improving market sentiment, consistent dip-buying, and a tightening ascending triangle structure suggests that Aster is approaching a critical decision point — one that could define its next significant move as 2026 begins.
Disclaimer: The views and analysis presented in this article are for informational purposes only and reflect the author’s perspective, not financial advice. Technical patterns and indicators discussed are subject to market volatility and may or may not yield the anticipated results. Investors are advised to exercise caution, conduct independent research, and make decisions aligned with their individual risk tolerance.
About Author: Nilesh Hembade is the Founder and Lead Author of Coinsprobe, with over 5 years of experience in the cryptocurrency and blockchain industry. Since launching Coinsprobe in 2023, he has been providing daily, research-driven insights through in-depth market analysis, on-chain data, and technical research.
Disclaimer: The information on this page may come from third parties and does not represent the views or opinions of Gate. The content displayed on this page is for reference only and does not constitute any financial, investment, or legal advice. Gate does not guarantee the accuracy or completeness of the information and shall not be liable for any losses arising from the use of this information. Virtual asset investments carry high risks and are subject to significant price volatility. You may lose all of your invested principal. Please fully understand the relevant risks and make prudent decisions based on your own financial situation and risk tolerance. For details, please refer to
Disclaimer.
Related Articles
REQ Soars 21.77% — What Does This Mean for Traders?
Request Network (REQ) surged 21.77% within an hour, reaching $0.0839 amid growing trader interest. Market conditions, bullish sentiment, and DeFi trends may be driving this rally, while traders monitor key resistance and support levels for future movements.
Coinfomania34m ago
Goldman Sachs Becomes Largest Holder of XRP ETFs With $153.8 Million in Holdings
Goldman Sachs becomes largest holder of XRP ETFs.
The entity now holds a total of $153.8 million in holdings.
This shows a promising future for the price of XRP.
The crypto community is thrilled to see the slight rise in crypto prices today. Presently, the price of Bitcoin (BTC), the p
CryptoNewsLand35m ago
BTC 15-minute decline of 0.61%: Major wallet selling pressure combined with negative US employment data triggers adjustment
Between 2026-03-12 14:15 and 14:30 (UTC), BTC price declined from 70660.0 USDT to 69917.2 USDT, with a 15-minute return rate of -0.61% and volatility reaching 1.06%. Trading volume increased sequentially, with market attention rising notably, and heightened fluctuations triggering alerts among short-term traders.
The primary driver of this price movement was on-chain whale wallets concentrating approximately 2,100 BTC inflows to exchanges within a short timeframe, representing an 18% increase compared to the previous period. Large holders' active position adjustments and concurrent large sell orders in spot and perpetual markets were simultaneously released.
GateNews54m ago
Stablecoin neo EURO captures only 0.35% of market supply
Stablecoins pegged to the EURO only represent 0.35% of total supply and less than 0.1% of total global trading volume, demonstrating limited market liquidity significance compared to USD stablecoins. Notable EURO stablecoins include EURC, EURCV, AEUR, EURI, and EURe.
TapChiBitcoin1h ago
ETH 15-minute rise of 0.72%: On-chain capital inflows and bullish sentiment dominating the market
2026-03-12 14:00 to 2026-03-12 14:15 (UTC), ETH spot price showed rapid upward movement with a 15-minute return rate of +0.72%, price range between 2065.45 to 2082.77 USDT, and overall volatility of 0.84%. During this market fluctuation, market attention increased, trading volume rose sequentially, and unilateral buy-side orders drove market sentiment to remain bullish.
The main driver of this price movement was large-scale on-chain capital inflows and the linkage effect between spot and futures markets. On-chain data shows multiple high-net-worth wallets
GateNews1h ago
Altcoin About to 10x? History Is Literally Repeating Itself
Crypto analysts suggest the altcoin market may be entering another expansion phase, similar to patterns seen in past rallies. While investor interest grows, indicators show the altcoin cycle hasn't begun yet, with high Bitcoin dominance and a low Altcoin Season Index.
Coinfomania1h ago