Filecoin (FIL) is currently leading the group of AI and big data-related tokens in terms of development activity, according to Santiment’s disclosure in a post on X platform. Following closely is Chainlink (LINK), while Internet Computer (ICP) ranks third.
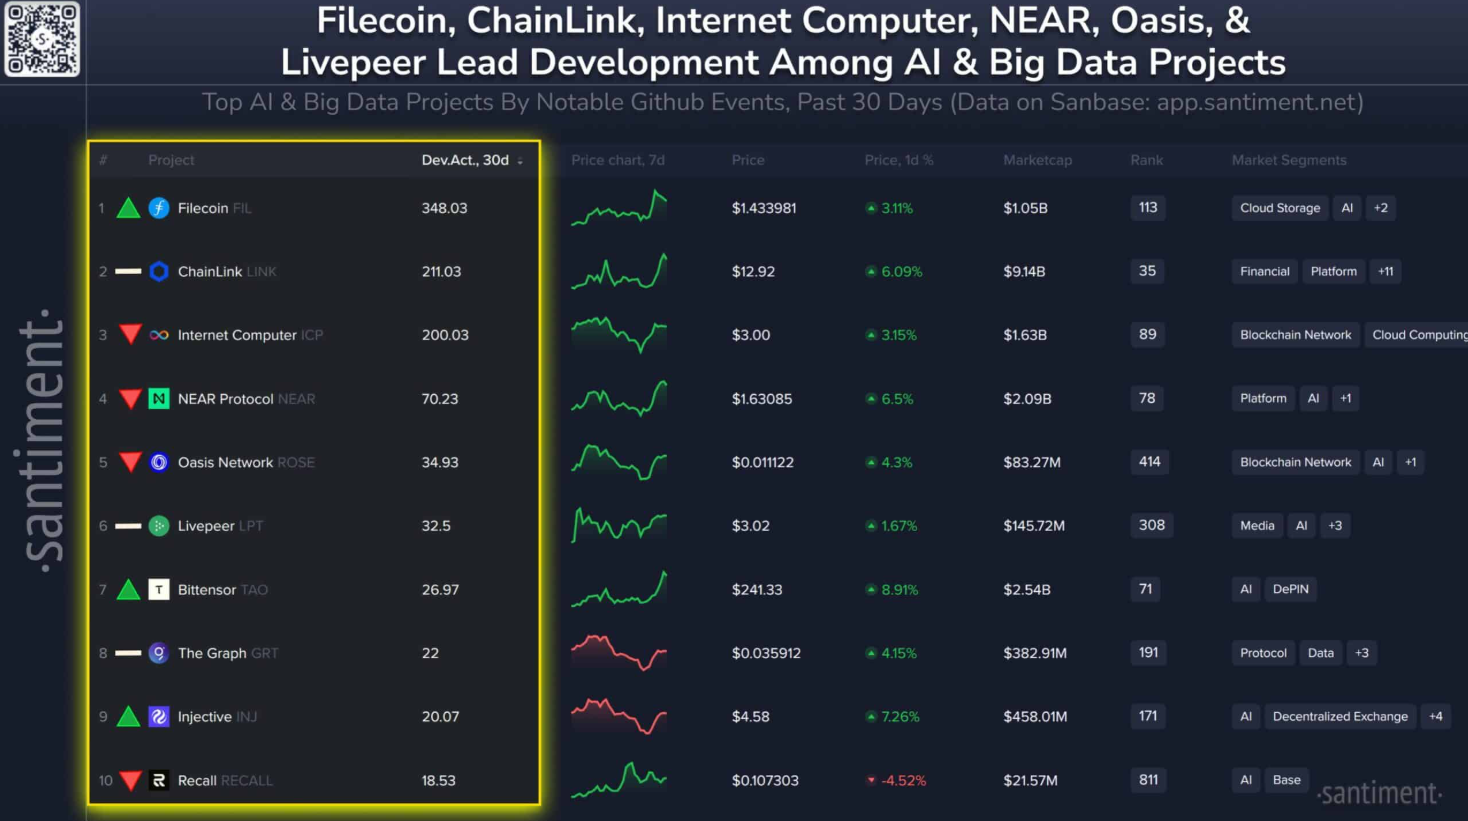 Source: Santiment According to this cryptocurrency data analysis platform, projects maintaining high development intensity often have a significant advantage in attracting users, thereby laying the foundation for sustainable long-term token demand growth.
Meanwhile, Coin Photon reports a significant increase in demand for LINK from large wallets. This accumulation trend is further reinforced as Chainlink’s reserve wallets have added more than 94,000 LINK to their holdings, indicating growing confidence from large investors.
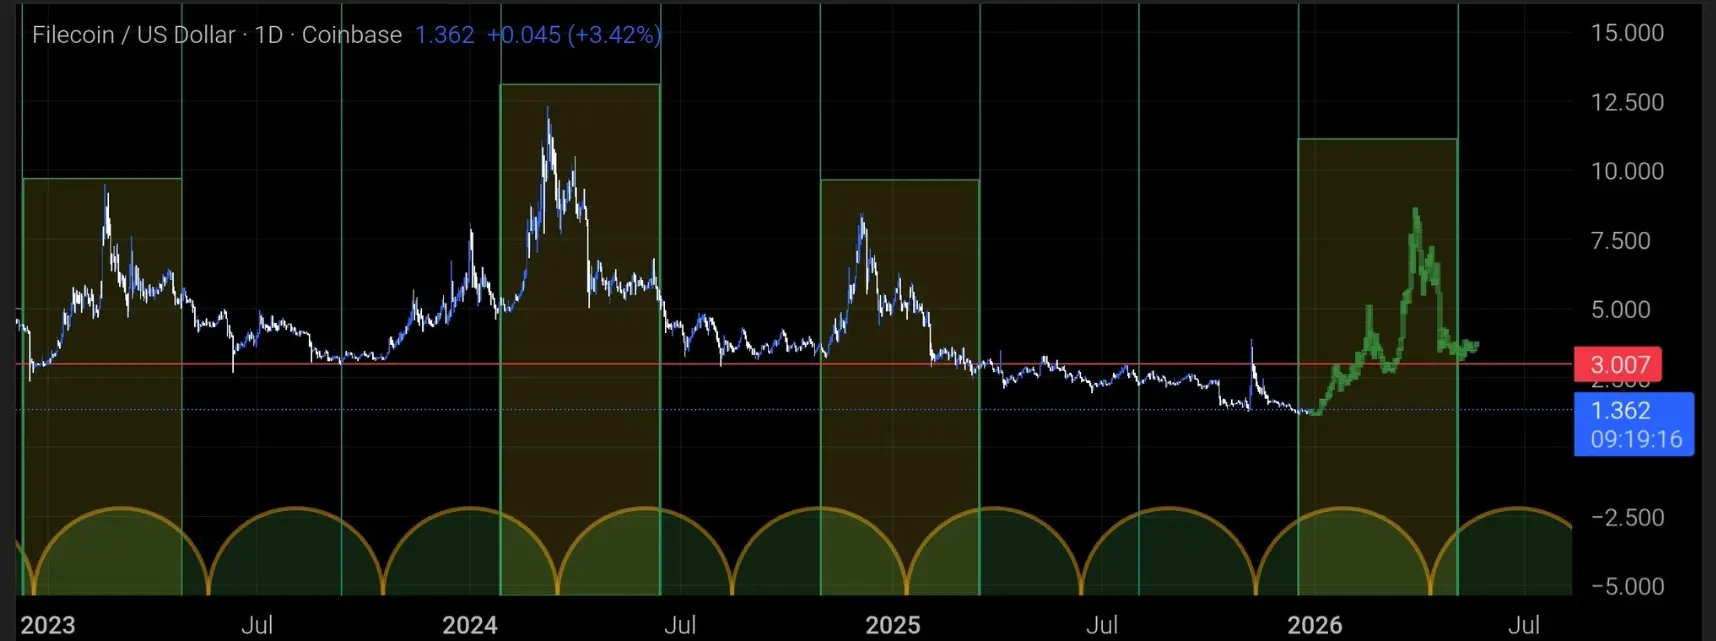 Source: XV regarding Filecoin, the bullish outlook is also attracting attention. In just one week, FIL has recorded an impressive 19.5% increase. An analyst on X stated that FIL often experiences strong breakouts in the first quarter of each year. If this historical pattern continues, the question is how high FIL could go, and whether it can outperform Chainlink in the upcoming cycle.
Long-term trend assessment of Filecoin and Chainlink
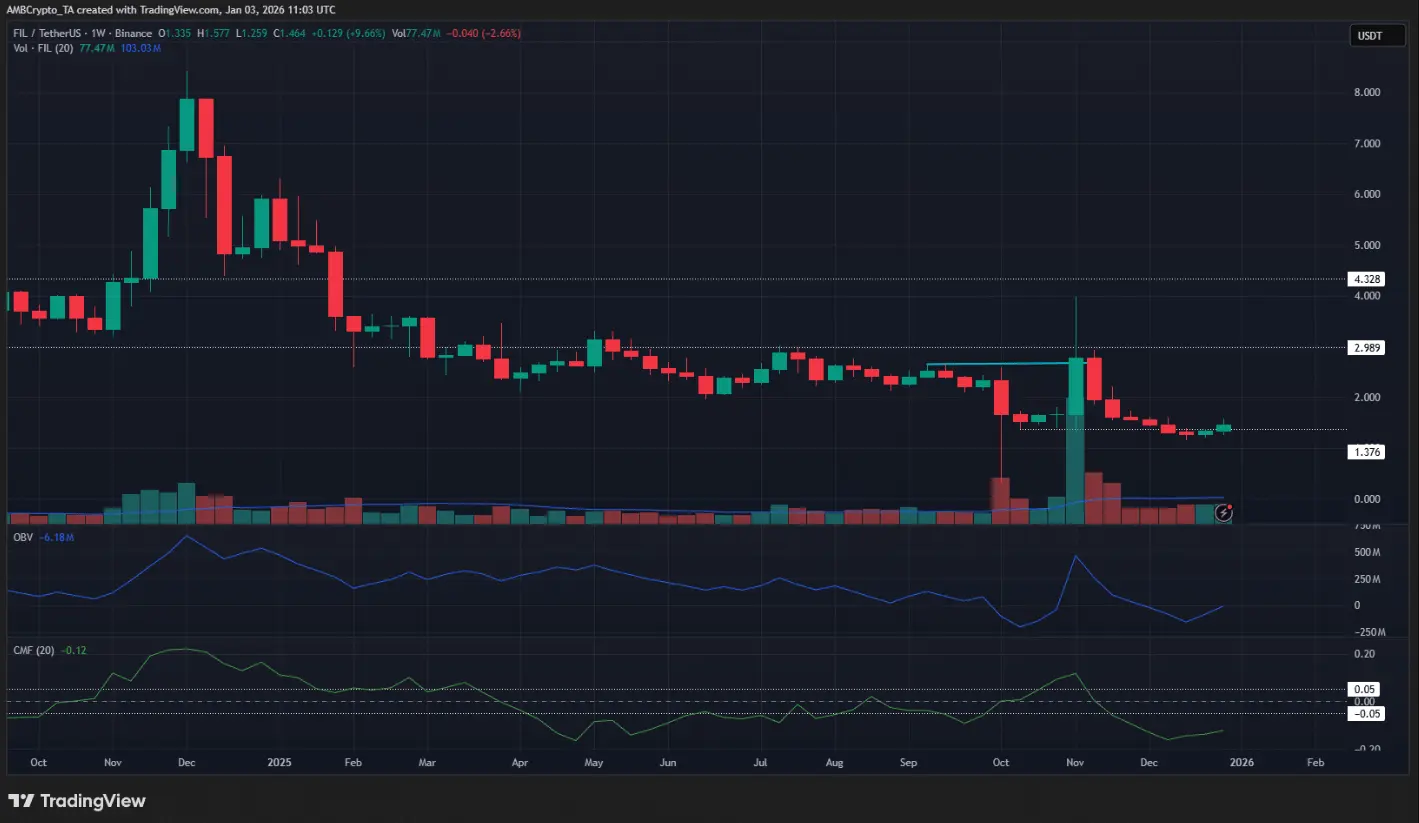 Weekly FIL/USDT chart | Source: TradingView From a technical perspective, the intrinsic structure of FIL still leans toward an upward scenario. However, a more cautious view suggests that the crash on 10/10 formed a swing bottom around $0.32 amid extreme market pressure, while the $1.37 level remains an important reference bottom. Based on this reasoning, FIL is still operating within an unbroken downtrend structure.
Regardless of the scenario, the larger timeframe trend for FIL remains downward throughout 2025. The psychological resistance zone at $3 has been tested multiple times but has yet to see a convincing breakout to confirm a trend reversal.
If FIL can replicate the familiar pattern of the past three years with a strong rally in Q1 2026, conquering and turning the $3 mark into a support zone will serve as a crucial activation signal for trend-following traders.
Volume indicators, when viewed in the context of the long-term downtrend, explain why FIL investors need to remain cautious despite the notable recovery over the past two weeks.
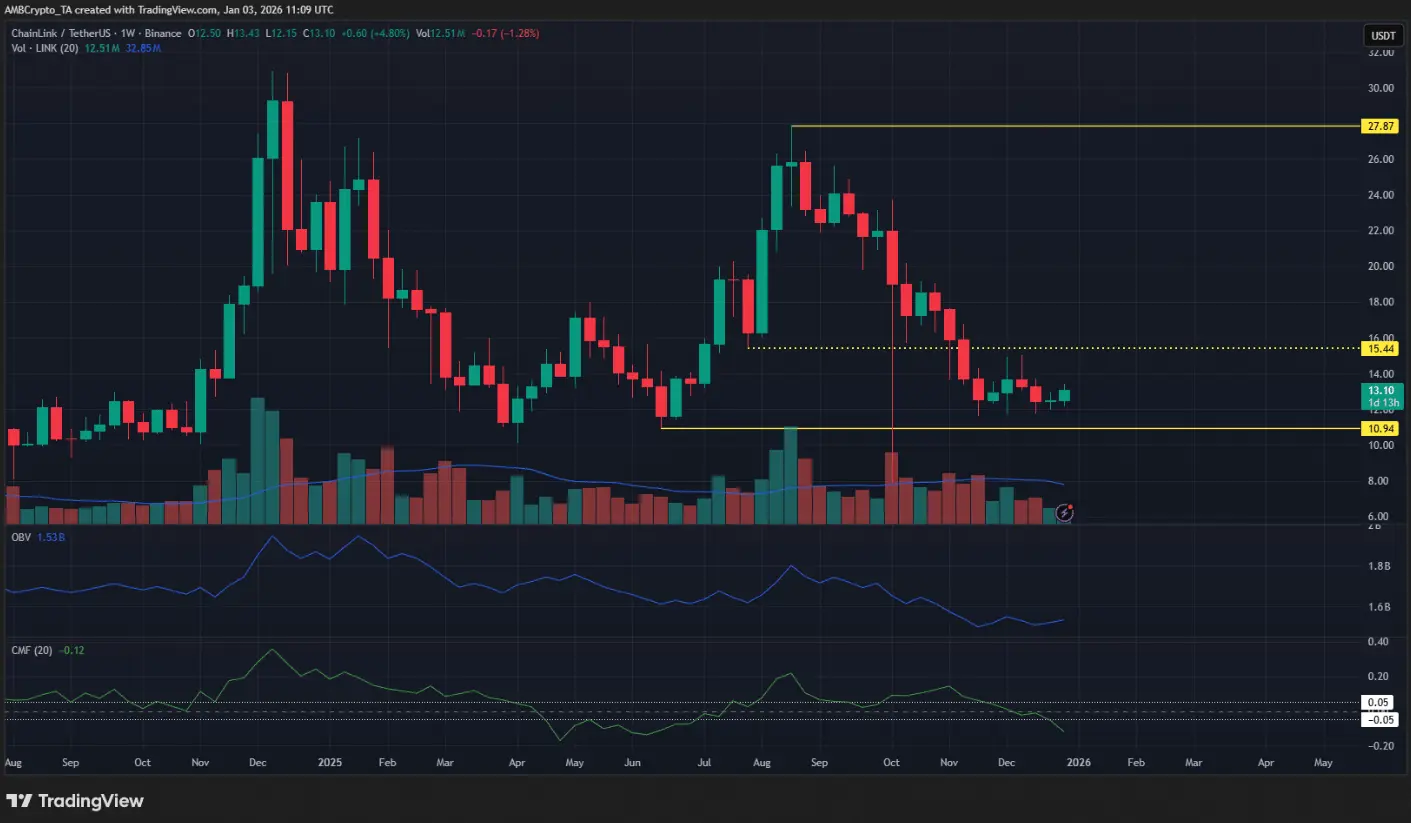 Weekly LINK/USDT chart | Source: TradingView For LINK, the oscillation structure on the weekly timeframe remains bullish, supported by a strong rally from June to August 2025. However, the intrinsic structure within the same timeframe indicates a downtrend, while volume signals continue to reflect the dominance of the bears.
Purely from a technical perspective, Chainlink is currently considered a more favorable choice than Filecoin, as LINK still maintains an upward oscillation structure – an important factor for trend-following trading strategies.
Investors interested in the AI token group should be aware that the altcoin market is still highly volatile and unstable. Participating with expectations of a recovery in Q1 is feasible, but it is essential to clearly define invalidation points for the scenario and avoid accepting high risks as seen during the overheated market growth phase.
Disclaimer: The information on this page may come from third parties and does not represent the views or opinions of Gate. The content displayed on this page is for reference only and does not constitute any financial, investment, or legal advice. Gate does not guarantee the accuracy or completeness of the information and shall not be liable for any losses arising from the use of this information. Virtual asset investments carry high risks and are subject to significant price volatility. You may lose all of your invested principal. Please fully understand the relevant risks and make prudent decisions based on your own financial situation and risk tolerance. For details, please refer to
Disclaimer.
Related Articles
Bitcoin Is Experiencing Its Longest Decoupling From the S&P 500 Since 2020
Bitcoin's recent price movements have diverged from U.S. equities, marking the longest decoupling since 2020. Following significant liquidation, Bitcoin's decline contrasts with a more stable S&P 500, highlighting crypto's unique challenges amid broader market stress.
BlockChainReporter26m ago
Scaramucci says BTC's 4-year cycle still in play, forecasts rise in Q4
The current Bitcoin (BTC) bear market can be explained by the four-year cycle and long-term BTC holders selling at the $100,000 psychological level, according to Anthony Scaramucci, managing partner of the SkyBridge investment firm.
Bitcoin’s four-year market cycle has been “muted” by
Cointelegraph1h ago
ETH up 0.95% in 15 minutes: Whale transfers and short liquidations resonate to push prices higher
Between 2026-03-23 12:30 and 12:45 (UTC), ETH recorded a +0.95% return rate, with a price range of 2120.7–2147.02 USDT and a volatility amplitude of 1.24%. During this period, market attention increased significantly, with intensified capital flows and volatility, and increased short-term trading activity.
The primary drivers of this price movement were large on-chain transfers and position structure adjustments in the derivatives market. Whales collectively transferred 30,354 ETH into new wallets, causing changes to market liquidity structure, which drove spot trading and expected volatility upward. Meanwhile, perpetual futures funding
GateNews2h ago
Goldman Sachs has Raised Average Price Forecast for Brent Crude, Crypto Prices to be Affected?
Goldman Sachs has raised Brent Crude oil's 2026 price forecast to $85 per barrel, signaling potential inflation impacts on the crypto market, where prices have recently recovered amidst ongoing uncertainty influenced by geopolitical tensions.
TheNewsCrypto2h ago
