Date: Sun, Dec 28, 2025 | 09:40 AM GMT
The broader cryptocurrency market is showing modest strength, with both Bitcoin (BTC) and Ethereum (ETH) trading in the green. This steady performance among major assets has helped stabilize overall sentiment, allowing select memecoins — including SPX6900 (SPX) — to begin showing constructive technical setups.
SPX is trading with a modest intraday gain, but more importantly, its price structure is starting to reflect a classic bullish reversal pattern. After weeks of sustained downside pressure, buyers appear to be stepping back in at key levels, hinting that the worst of the correction may already be behind.
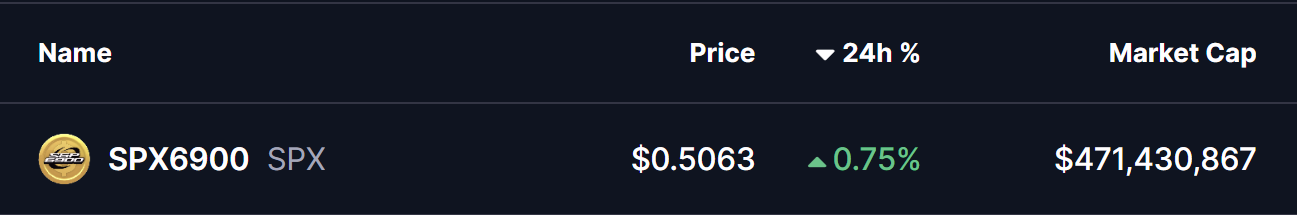
Source: Coinmarketcap
Double Bottom Pattern in Play
On the daily timeframe, SPX is forming a double bottom pattern — a widely followed bullish reversal structure that often appears near the end of prolonged downtrends. The first bottom formed in November when SPX dropped toward the $0.45 region, followed by a recovery that carried price back toward the neckline resistance near $0.7389 in early December.
That recovery attempt, however, was rejected, sending SPX back down to retest the same $0.45 support zone. Importantly, sellers failed to push price meaningfully lower on this second attempt. Instead, SPX printed another strong reaction from the same demand area and has since rebounded to trade around $0.5045.
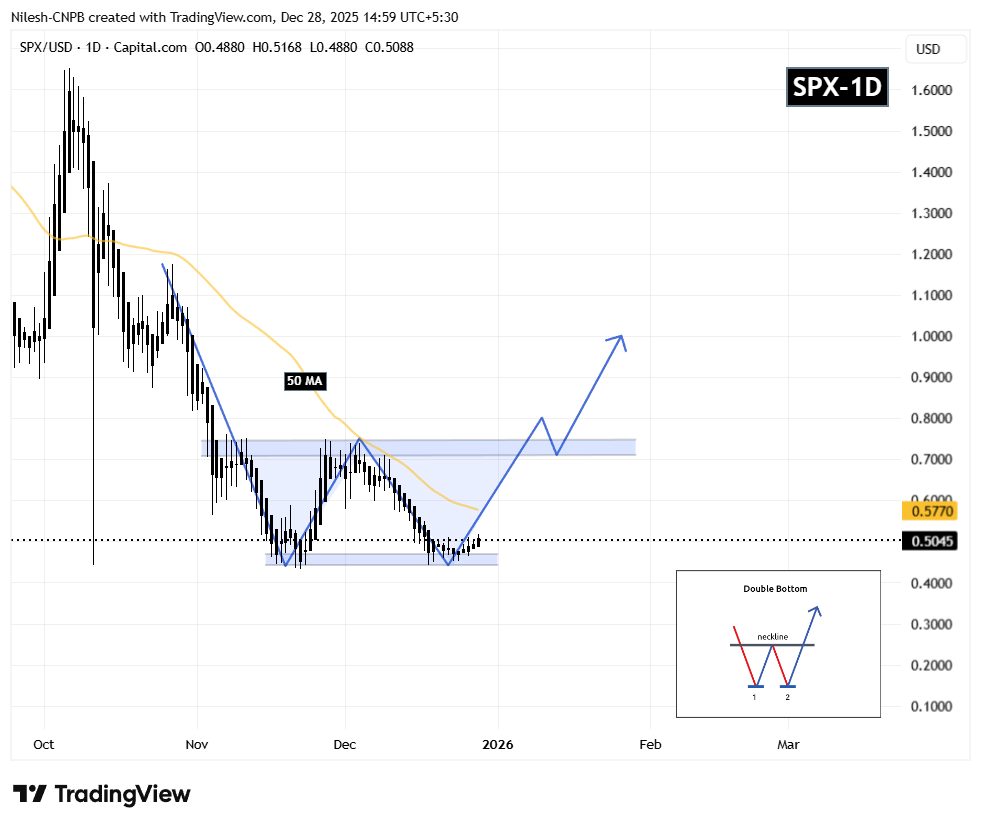
SPX6900 (SPX) Daily Chart/Coinsprobe (Source: Tradingview)
This repeated defense of the same support level is a critical technical signal. It suggests that selling pressure is weakening while buyers are gradually absorbing supply — a behavior typically seen during accumulation phases before trend reversals.
What’s Next for SPX?
For the bullish structure to strengthen, SPX must reclaim the 50-day moving average, currently positioned near $0.5770. A sustained move above this level would mark an important shift in short-term momentum and increase the probability of a continued recovery toward the neckline resistance at $0.7389.
A decisive breakout above the neckline — ideally followed by a successful retest — would confirm the full activation of the double bottom pattern. In that scenario, the technical projection points toward a potential upside target near $1.02, representing a significant expansion from current price levels.
Until then, the $0.45 support zone remains the most important level to watch. As long as SPX continues to hold above this area, the broader bullish setup stays intact and allows room for further upside attempts.
Overall, SPX’s structure appears constructive. The presence of a double bottom, repeated demand at identical lows, and proximity to the 50-day moving average suggest that this could be a pivotal moment as the token attempts to transition from accumulation into a new expansion phase.
Disclaimer: The views and analysis presented in this article are for informational purposes only and reflect the author’s perspective, not financial advice. Technical patterns and indicators discussed are subject to market volatility and may or may not yield the anticipated results. Investors are advised to exercise caution, conduct independent research, and make decisions aligned with their individual risk tolerance.
About Author: Nilesh Hembade is the Founder and Lead Author of Coinsprobe, with over 5 years of experience in the cryptocurrency and blockchain industry. Since launching Coinsprobe in 2023, he has been providing daily, research-driven insights through in-depth market analysis, on-chain data, and technical research.

Disclaimer: The information on this page may come from third parties and does not represent the views or opinions of Gate. The content displayed on this page is for reference only and does not constitute any financial, investment, or legal advice. Gate does not guarantee the accuracy or completeness of the information and shall not be liable for any losses arising from the use of this information. Virtual asset investments carry high risks and are subject to significant price volatility. You may lose all of your invested principal. Please fully understand the relevant risks and make prudent decisions based on your own financial situation and risk tolerance. For details, please refer to
Disclaimer.
Related Articles
XRP Price Just Flashed a Hidden Macro Retest – Analysts Predict the Real Fireworks
XRP is undergoing a significant macro breakout retest, suggesting potential for a notable upward move towards $15. Analyst insights indicate bullish momentum as buyers gain strength, with a successful retest validating the bullish outlook for sustained growth.
CaptainAltcoin1h ago
Bitcoin Rejects $76K as War and PPI Rock Markets
_ Bitcoin rejected $76,000 resistance as US strikes on Iran, hot PPI at 3.4%, and Powell’s FOMC tone sent crypto and risk assets into a sell-off._
Bitcoin hit $76,000 and turned back around. The rejection was clean. Sellers were waiting right at the level that traders had marked for
LiveBTCNews1h ago
Gold Price Dip Deepens – Is Smart Money Forcing the Market Lower?
Gold prices just took a nosedive, and people are trying to figure out why. Sure, markets move fast. But something about this drop feels off.
A trader named Wimar.X pointed out that hedge funds might be behind it. Here is the kicker. The CFTC data shows that hedge funds opened new short
CaptainAltcoin2h ago
'How Did You Manage That?': Peter Schiff Trolls Michael Saylor Over 4.5% Bitcoin Loss and $44 Billion Plans - U.Today
Michael Saylor continues to invest heavily in Bitcoin, purchasing $76.6 million worth despite facing criticism from Peter Schiff about recent losses. Saylor aims to acquire one million BTC, supported by a new $44.1 billion funding plan, while Schiff highlights the ongoing portfolio drawdown.
UToday3h ago
Cardano (ADA) Price Reclaims $0.26 as Volume Rockets 60% - U.Today
Cardano (ADA) has recovered to $0.26, up 3% with a 60% increase in trading volume. While analysts caution it remains range-bound, historical data suggests a potential bullish close in March, driven by market trends and DeFi growth.
UToday3h ago
Aster (ASTER) Price Breakout Fails After 35-Day Consolidation – What Happens Next?
The ASTER price has been consolidating for over a month, fluctuating without significant movement. A failed breakout led to a loss of key support at $0.68, indicating a bearish trend. The focus now is on whether it can recover above $0.68 to regain stability.
CaptainAltcoin4h ago
