
Date: Sun, Dec 21 2025 | 08:56 AM GMT
The broader cryptocurrency market has remained under pressure over the past several weeks, following the sharp sell-off that began on October 10. That corrective phase dragged Ethereum (ETH) down by nearly 23% over the last 60 days and weighed heavily on overall market sentiment. While many altcoins have struggled to stabilize, Quant (QNT) has shown relative resilience, posting only a modest decline and holding above a historically important support zone.
From a technical perspective, the daily chart suggests that QNT may be approaching a critical decision point, with price action forming a recognizable structure that could influence its next directional move.
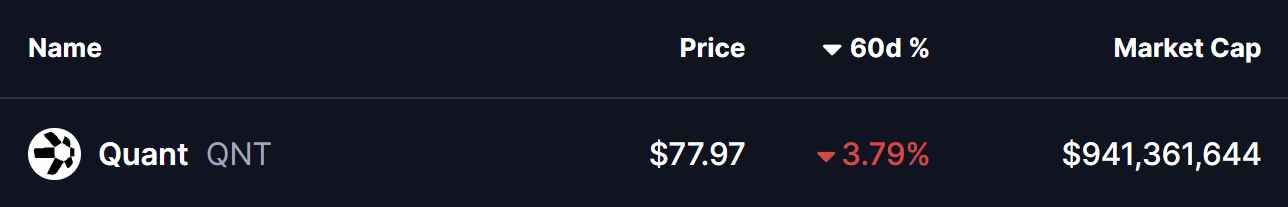
Source: Coinmarketcap
Head and Shoulders Pattern Takes Shape
On the daily timeframe, QNT appears to be carving out a head and shoulders formation, a well-known pattern that often signals a potential trend shift once the neckline is tested. Earlier in the structure, QNT formed the left shoulder before rallying sharply to its head near the $100 region. From there, price reversed lower and slid back toward the neckline, located around the $70 support zone.
This $70 area has proven to be a strong demand zone in the past, repeatedly attracting buyers and preventing deeper declines. The recent move into this region was met with a noticeable reaction, as reflected by the long lower wick on the chart. That rejection from support pushed price back toward the $78 level, suggesting that buyers are actively defending the neckline and potentially forming the right shoulder of the pattern.
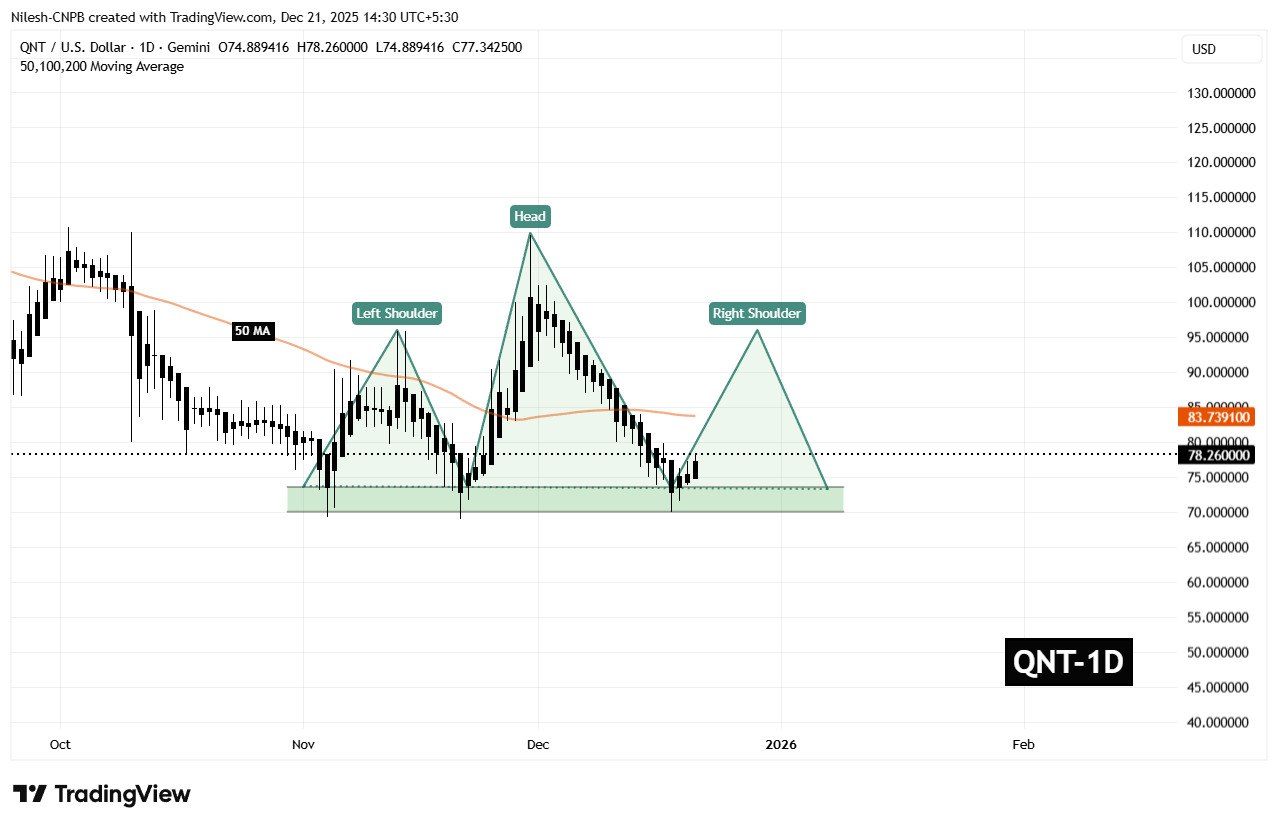
Quant (QNT) Daily Chart/Coinsprobe (Source: Tradingview)
The behavior around this zone is critical. A successful defense of the neckline often opens the door for a relief rally, especially if broader market conditions stabilize.
What’s Next for QNT?
For bullish momentum to build, QNT needs to reclaim the 50-day moving average, currently sitting near $83.73. This level now acts as a key short-term resistance, and a daily close above it would signal a shift in momentum back in favor of buyers.
If that recovery unfolds, the chart points toward a potential move into the $95.90 region. Such a move would represent a rebound of roughly 22% from current levels and align with the typical reaction seen during the right-shoulder phase of this pattern. A rally of this nature would not only ease recent selling pressure but also place QNT back into a more neutral technical posture.
That said, the setup remains delicate. If the $70 neckline support fails to hold on a sustained basis, the head and shoulders structure would remain bearish, opening the door to further downside and extending the corrective phase. For now, all eyes remain on how price behaves around this key support and whether buyers can regain control above the moving average.
Disclaimer: The views and analysis presented in this article are for informational purposes only and reflect the author’s perspective, not financial advice. Technical patterns and indicators discussed are subject to market volatility and may or may not yield the anticipated results. Investors are advised to exercise caution, conduct independent research, and make decisions aligned with their individual risk tolerance.
Disclaimer: The information on this page may come from third parties and does not represent the views or opinions of Gate. The content displayed on this page is for reference only and does not constitute any financial, investment, or legal advice. Gate does not guarantee the accuracy or completeness of the information and shall not be liable for any losses arising from the use of this information. Virtual asset investments carry high risks and are subject to significant price volatility. You may lose all of your invested principal. Please fully understand the relevant risks and make prudent decisions based on your own financial situation and risk tolerance. For details, please refer to
Disclaimer.
Related Articles
Here’s Why SIREN Price Exploded 115% Today
SIREN's price surged 115% in a day, driven by a volume spike, yet on-chain data reveals a concentration of supply controlled by a few wallets. This raises concerns about volatility and potential price fluctuations moving forward.
CaptainAltcoin2m ago
Bittensor (TAO) Is Up 140% in 6 Weeks, But Data Shows Retail Is Missing the Big AI Rally
Bittensor has recorded a 140% price increase over the past six weeks, including a 105% rise since March 8.
The latest price action has pushed it to the 26th-largest cryptocurrency by market capitalization, according to new data from Santiment.
AI Tokens Heat Up
-----------------
The rally comes a
CryptoPotato23m ago
Bittensor TAO Jumps 17% as Market Momentum Strengthens
Key Insights:
Bittensor surged 17% in one day, with strong weekly and monthly gains supported by broader crypto stability and rising investor participation.
Institutional access expanded through new exchange products while Grayscale’s trust premium signaled sustained demand for
CryptoNewsLand52m ago
XRP Faces Pressure as Network Usage and Momentum Decline
Key Insights
XRP Ledger transactions and active accounts dropped sharply, signaling reduced usage and weakening demand that directly impacts the asset’s broader market outlook.
Price continues to face resistance at key technical levels, while compression below moving averages reflects
CryptoNewsLand1h ago
Ethereum Whales Buy the Dip, Eyes on $1,900
_ETH whales log second-largest accumulation inflow this cycle as traders call weekend chop near $2,000 before a potential $1,900 dip next week._
Ethereum is sitting near the $2,000 mark. Whales are not waiting. On-chain data shows large holders ramping up ETH purchases at a rate unseen since the cu
LiveBTCNews1h ago
XRP Sees 233% Spot Flow Surge Amid Rising Trading Activity
Key Insights:
XRP spot flows jumped 233% in one hour, highlighting increased direct market participation and signaling heightened short-term trading momentum across exchanges.
Price structure mixed signals: XRP forms higher lows while remaining below major averages, indicating easing
CryptoFrontNews1h ago
