 The post Solana Price Analysis: Is SOL Setting Up for a Bullish Correction or Another Leg Lower? appeared first on Coinpedia Fintech News
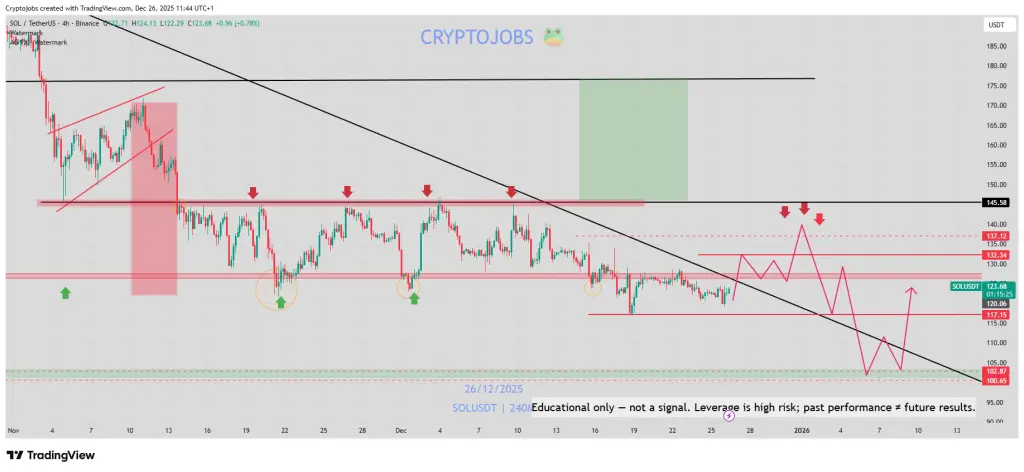
Solana is trading at a critical turning point after an extended downtrend. Following a sharp sell-off from the November highs, SOL has spent the last several weeks consolidating above the $118–$120 zone. This area has now been defended multiple times, shifting focus to whether the current structure can support a bullish correction or if the SOL price is merely pausing before a continuation lower.
SOL Price Structure: Compression Below Key Resistance
On the 4-hour chart, Solana continues to trade below a descending trendline, keeping the broader structure bearish. However, price action has compressed into a tightening range, forming a reversal wedge pattern. This signals a reduction in downside momentum, even though sellers still control the trend.
 Source: X
![]() Importantly, each dip toward the $118–$120 region has been met with responsive buying. While this does not confirm a reversal, it shows that downside follow-through is weakening—a necessary condition for any corrective bounce to develop.
Importantly, each dip toward the $118–$120 region has been met with responsive buying. While this does not confirm a reversal, it shows that downside follow-through is weakening—a necessary condition for any corrective bounce to develop.
Momentum Signals Are Improving, but the Trend Is Not Reversed
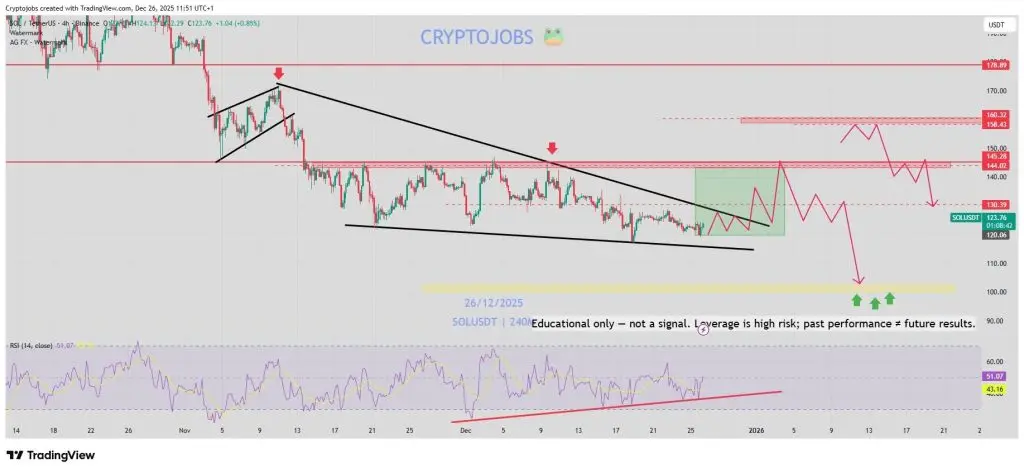 Momentum indicators are starting to diverge from price. On the 4-hour timeframe, RSI is printing a bullish divergence, suggesting selling pressure is fading despite price remaining capped. On the daily chart, a double-bottom-like structure is forming, adding to the base-building narrative.
That said, these are early signals, not confirmation. Until Solana reclaims key resistance zones, the move should be treated as a counter-trend correction, not the start of a new uptrend.
Key Levels That Will Decide the Next Move
Traders should stay focused on clean, well-defined levels:
- Major support: $118–$120
- Near-term resistance: $132–$136
- Heavy supply zone: $145–$158 → $160
- Invalidation: Sustained break below $118
- Bearish continuation target: $105 → $100
As long as SOL trades below $145–$160, sellers retain higher-timeframe control. Any rally into this zone should be evaluated carefully for acceptance or rejection.
What Needs to Happen for a Bullish Correction
For a meaningful corrective rally to play out, Solana needs:
- A break and acceptance above the descending trendline
- Sustained trading above $132 with volume expansion
- Momentum is holding firm above the RSI midline
Without these confirmations, upside moves risk becoming lower-high setups rather than structural reversals.
What the Solana Chart Is Signaling Right Now
Solana (SOL) price is showing conditions for a bounce, but not confirmation of a trend shift. The $118–$120 support remains the key line in the sand. Holding it keeps the door open for a corrective move toward $145–$160, while failure would likely reopen the path toward $100.
For traders, this is a reaction zone, not a conviction long. Let price prove strength before assuming the worst is over.
Disclaimer: The information on this page may come from third parties and does not represent the views or opinions of Gate. The content displayed on this page is for reference only and does not constitute any financial, investment, or legal advice. Gate does not guarantee the accuracy or completeness of the information and shall not be liable for any losses arising from the use of this information. Virtual asset investments carry high risks and are subject to significant price volatility. You may lose all of your invested principal. Please fully understand the relevant risks and make prudent decisions based on your own financial situation and risk tolerance. For details, please refer to
Disclaimer.
Related Articles
BTC-Gold Gap Reflects Retail vs Central Bank Demand Split, Analyst Says
The 2026 split between gold and Bitcoin is being read through the lens of two distinct buyer groups, according to Stephen Coltman, head of macro at 21Shares, a provider of crypto exchange-traded products. While gold has benefited from a sustained wave of central-bank purchases, Bitcoin remains
CryptoBreaking18m ago
BTC 15-minute rise of 0.49%: ETF fund net inflows and short squeeze liquidations drive gains together
During the period from 2026-03-22 22:15 to 22:30 (UTC), BTC experienced significant volatility within a short-term range, with the 15-minute candlestick recording a +0.49% gain and closing at 68371.1 USDT. The low touched 67861.4 USDT, with an overall amplitude of 0.75%. Short-term market activity was active, market attention increased, trading volume expanded noticeably compared to the previous period, and active capital flows drove this wave of volatility.
The main driver of this volatility was continuous inflows into US spot ETFs, as well as BTC net outflows at the exchange level. Specifically, according on-chain data shows,
GateNews1h ago
SEC: Shiba Inu (SHIB) Not Security, Ripple's Chris Larsen Injects 261 Million XRP Into $1 Billion Evernorth, BTC Price Reacts to Fed's Decision — Top Weekly Crypto News - U.Today
XRP-based institutional giant to hit $1 billion
SEC clears SHIB regulatory status
Bitcoin reacts to Fed's latest rate decision
XRP's rising support forms near $1.53
XRP-based institutional giant to hit $1 billion
New SEC S-4 filing reveals SBI Holdings paid $10/share as Ripple's Chris
UToday1h ago
Bitcoin at $68K triggers nearly $400M in crypto liquidations.
Bitcoin (BTC) traded just below the $69,000 mark as traders braced for a pivotal weekly candle close, with prices hovering near the long-term line around $68,300. After a weekend slide, the setup underscores a tug-of-war between a fragile near-term outlook and the possibility of a contrarian move, e
CryptoBreaking2h ago
Bitcoin Options Signal Fear Amid Subdued BTC ETF Outflows
Bitcoin traded in a narrow range near $70,000 on Friday after a stumble to reclaim the $75,000 level earlier in the week. The back-to-back sessions of net outflows from U.S.-listed spot Bitcoin ETFs cooled a recent run of inflows, prompting traders to reassess whether institutions are turning more c
CryptoBreaking2h ago
BTC Drops 0.58% in 15 Minutes: Tight Liquidity and Institutional Hedging Create Downward Pressure
2026-03-22 21:00 to 21:15 (UTC), BTC recorded a -0.58% return within just 15 minutes, with prices fluctuating in the range of 67562.1 to 68223.5 USDT, with an amplitude of 0.97%. During this period, market sentiment was highly tense, overall attention increased, and short-term volatility accelerated noticeably.
The main driving force behind this anomaly was the resonance formed by spot market liquidity shortage and medium-sized funds accelerating their exit. On-chain data shows a significant net outflow of -371.99 BTC in the $100k-$1M transaction range, driving selling
GateNews2h ago
