Trade
Trading Type
Spot
Trade crypto freely
Alpha
Points
Get promising tokens in streamlined on-chain trading
Pre-Market
Trade new tokens before they are officially listed
Margin
Magnify your profit with leverage
Convert & Block Trading
0 Fees
Trade any size with no fees and no slippage
Leveraged Tokens
Get exposure to leveraged positions simply
Futures
Futures
Hundreds of contracts settled in USDT or BTC
Options
HOT
Trade European-style vanilla options
Unified Account
Maximize your capital efficiency
Demo Trading
Futures Kickoff
Get prepared for your futures trading
Futures Events
Participate in events to win generous rewards
Demo Trading
Use virtual funds to experience risk-free trading
Earn
Launch
CandyDrop
Collect candies to earn airdrops
Launchpool
Quick staking, earn potential new tokens
HODLer Airdrop
Hold GT and get massive airdrops for free
Launchpad
Be early to the next big token project
Alpha Points
NEW
Trade on-chain assets and enjoy airdrop rewards!
Futures Points
NEW
Earn futures points and claim airdrop rewards
Investment
Simple Earn
Earn interests with idle tokens
Auto-Invest
Auto-invest on a regular basis
Dual Investment
Buy low and sell high to take profits from price fluctuations
Soft Staking
Earn rewards with flexible staking
Crypto Loan
0 Fees
Pledge one crypto to borrow another
Lending Center
One-Stop Lending Hub
VIP Wealth Hub
Customized wealth management empowers your assets growth
Private Wealth Management
Customized asset management to grow your digital assets
Quant Fund
Top asset management team helps you profit without hassle
Staking
Stake cryptos to earn in PoS products
BTC Staking
HOT
Stake BTC and earn 10% APR
GUSD Minting
Use USDT/USDC to mint GUSD for treasury-level yields
More


AAChenHaoyu
No content yet
AAChenHaoyu
12.1 evening
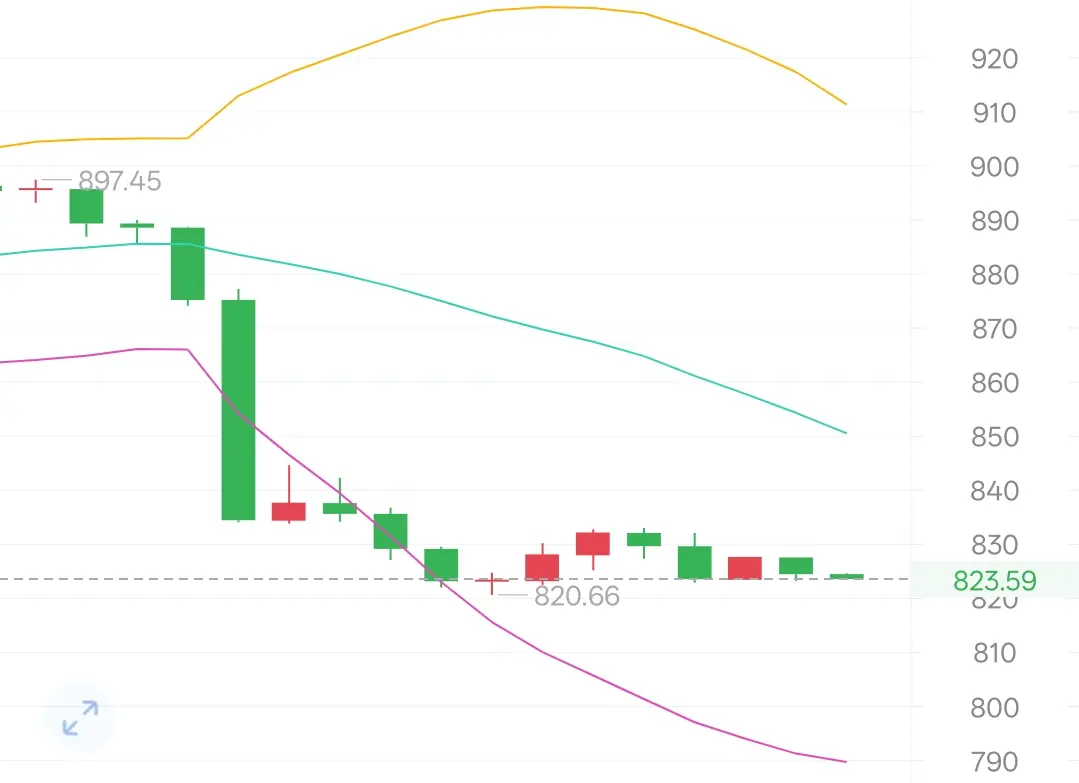
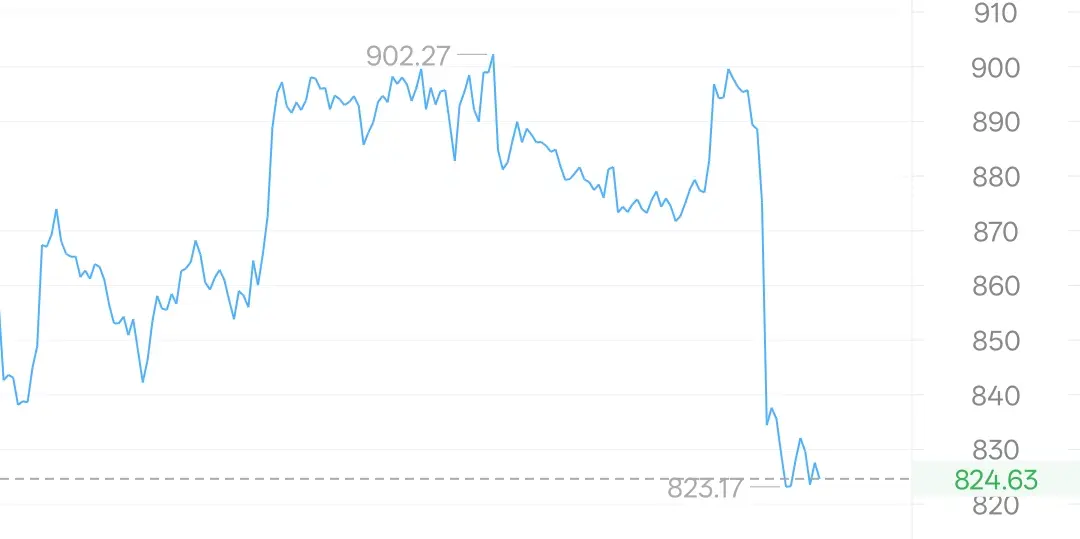
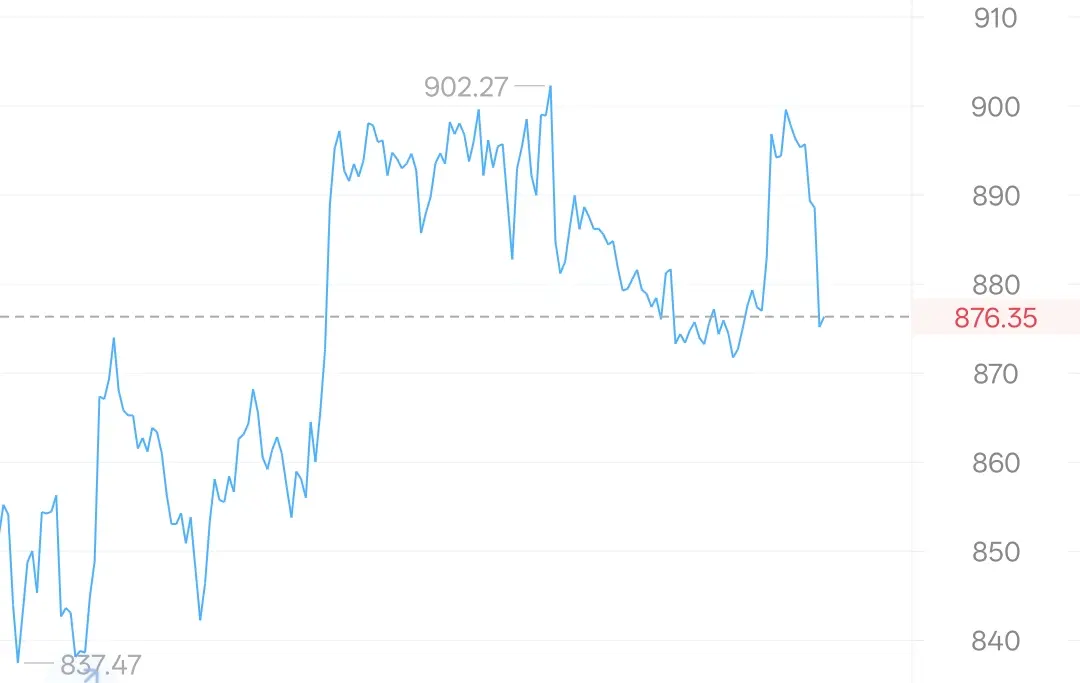
From the 1-hour K-line chart, BNB's short-term trend is in a clear downward trend, quickly falling from 900.35 to 823.55, a decrease of 6.72%; it is currently oscillating around the price of 823.55 in a downward trend; the support level below is 789.75, and if this level is broken, it may further decline; the resistance level above is 850.54, and if it can break through this level, it may trigger a rebound.
A large bearish candlestick has appeared on the K-line, followed by small bearish and bullish candlesticks, indicating that the bears are relatively strong, but the bulls a
BNB-5.74%
- Reward
- 1
- Comment
- Repost
- Share
Evening of 12.1
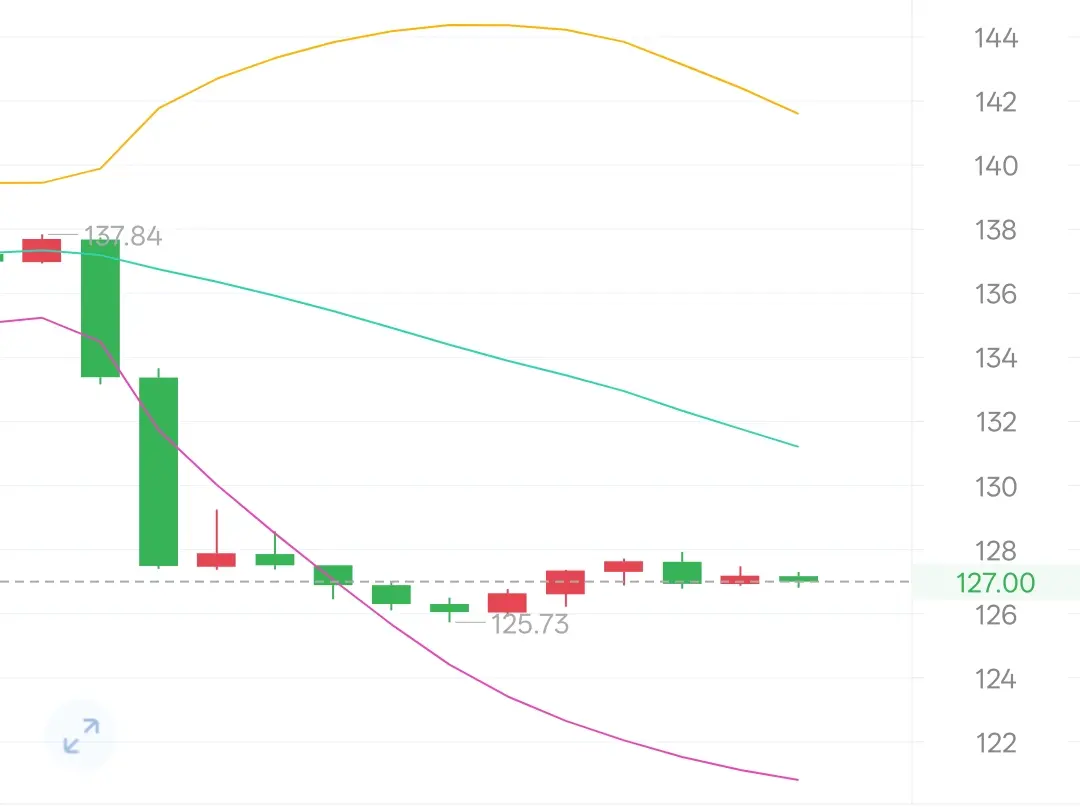
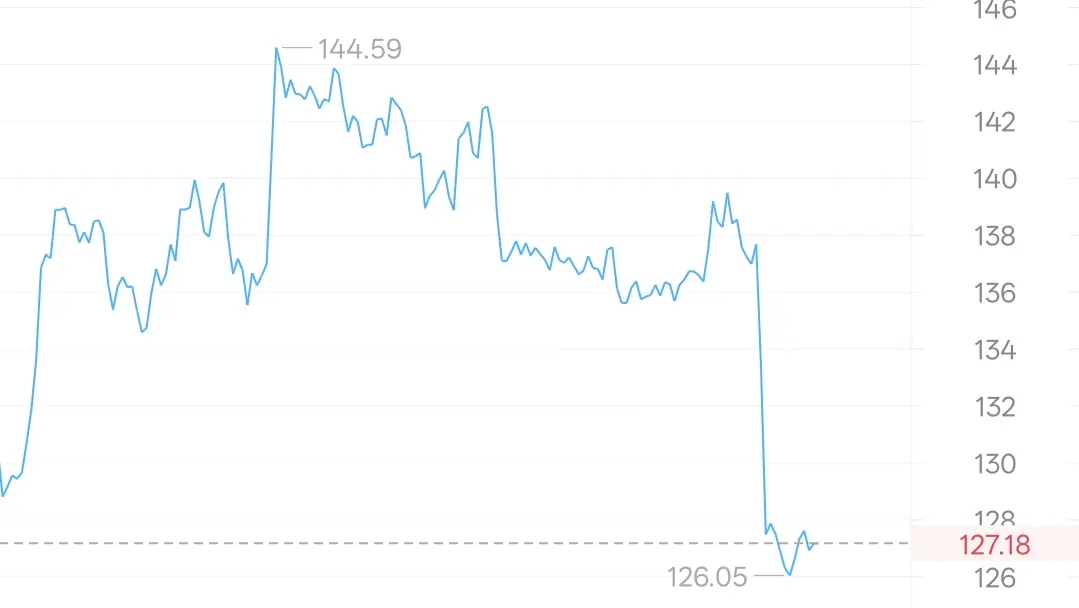
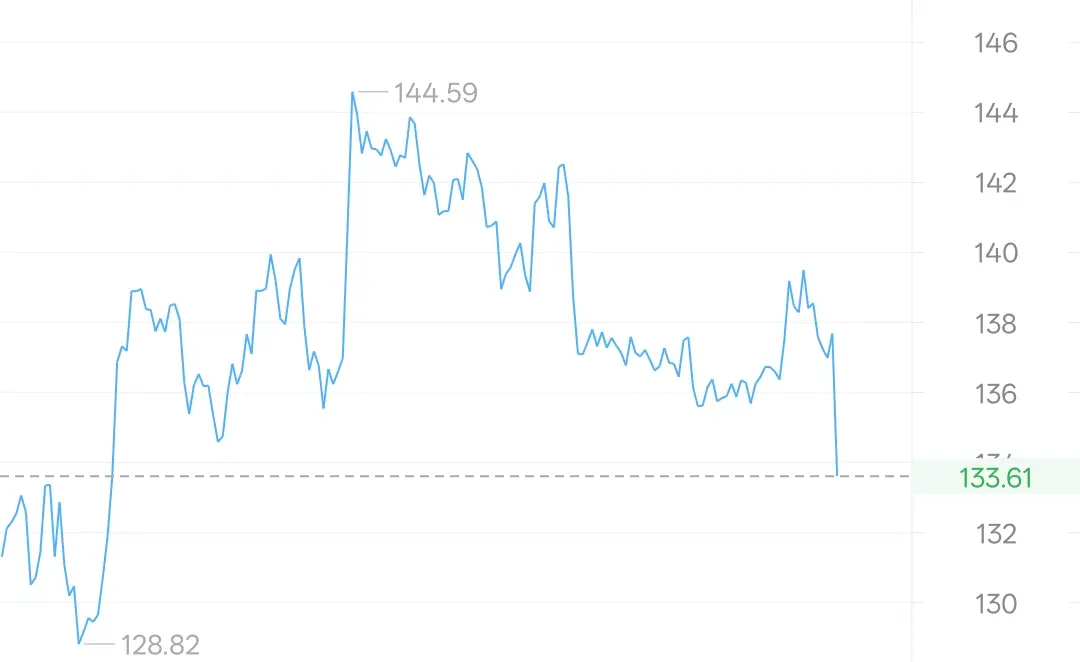
From the 1-hour K-line chart, the short-term trend of SOL is in a clear downward trend, quickly dropping from 140.15 to 127.14, a decrease of 6.74%; it is currently in a downward trend, with prices fluctuating around 127.14. The support level in the short term is at 120.83; if this position is broken, it may further decline. The resistance level in the short term is at 131.21; if this position can be broken, it may trigger a rebound.
The candlestick pattern shows a large bearish candle, followed by small bearish and bullish candles, indicating that the bears are strong, but the
SOL-5.94%
- Reward
- 2
- 2
- Repost
- Share
AAChenHaoyu:
22View More
Evening of 12.1
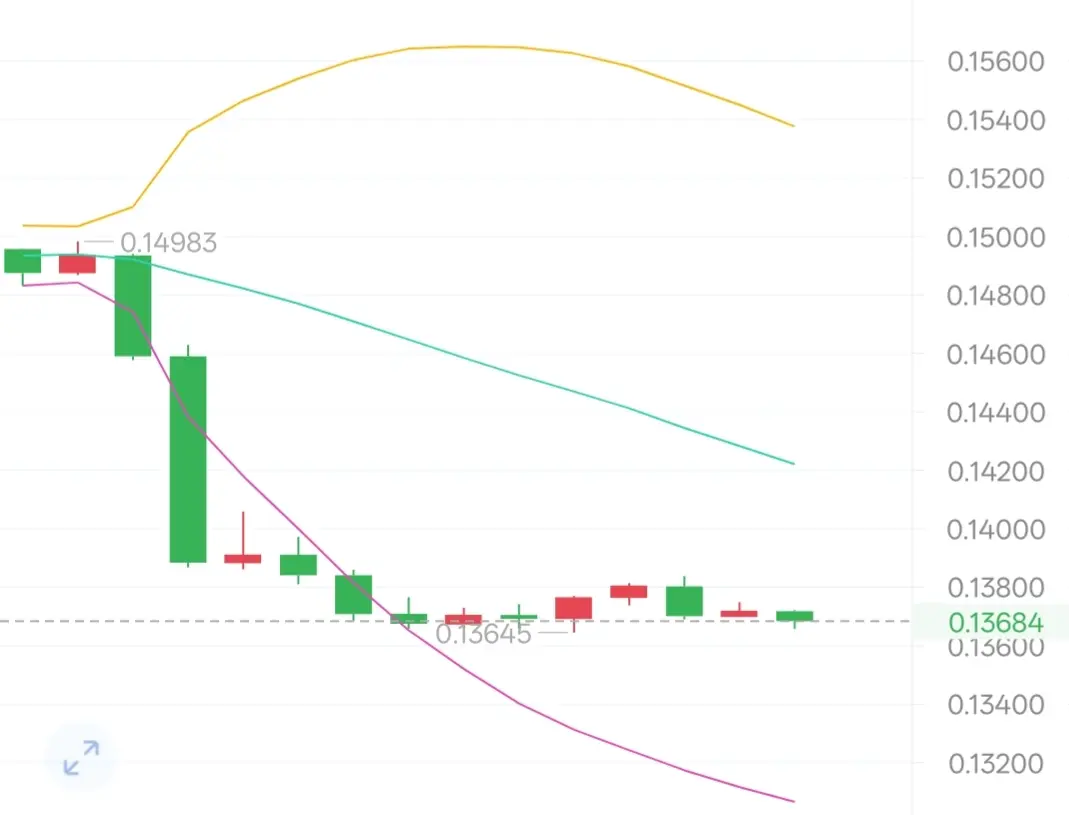
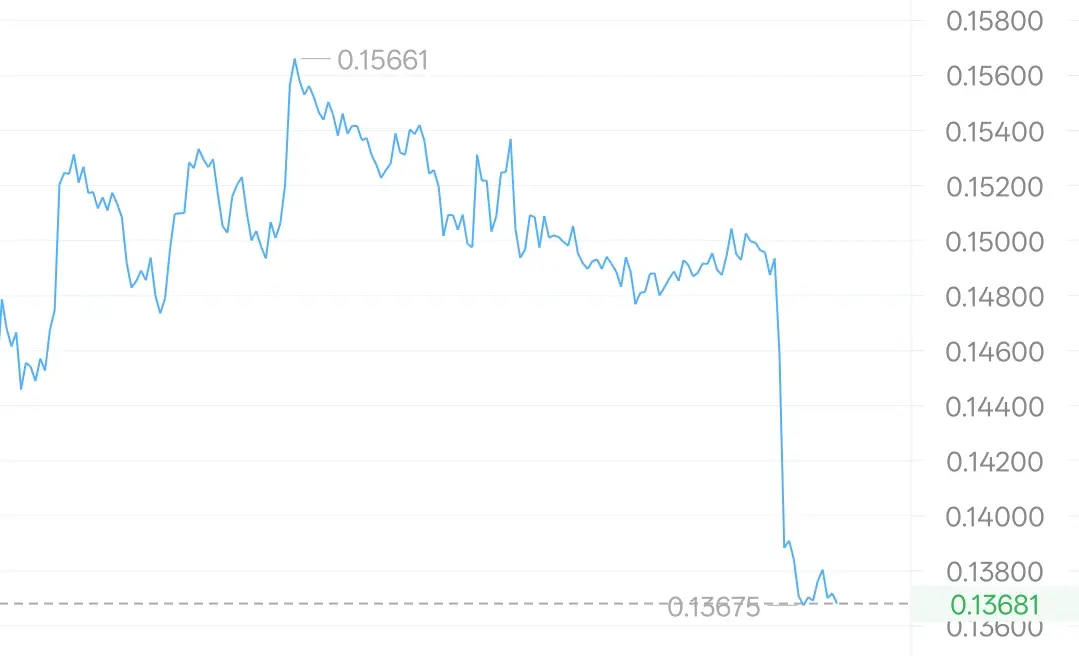
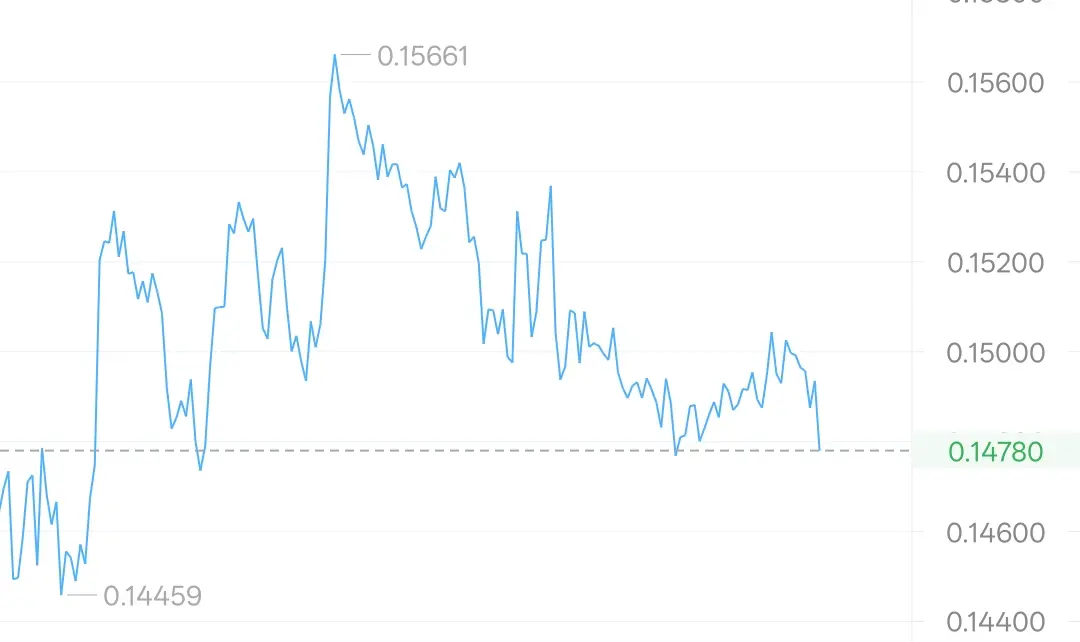
From the 1-hour candlestick chart, Doge's short-term trend is in a clear downtrend, quickly dropping from 0.1505 to 0.1368, a decrease of 7.99%; it is currently oscillating around 0.1368 during this downtrend; the support level below is 0.1306, and if this level is broken, it may further decline. The resistance level above is 0.1422, and if it can break through this level, it may trigger a rebound.
In the morning, a large bearish candlestick appeared in the K-line combination, followed by small bearish and bullish candlesticks, indicating that the bearish force is strong, b
DOGE-7.34%
- Reward
- 5
- 5
- 1
- Share
GateUser-68c6ac06:
Overall, doge is in a downtrend in the short term, but there are signs of a rebound; in the short term, it is recommended to buy lightly near the 0.13512--0.1328 position on a pullback, with the target looking towards the 0.138--0.140 position.View More
Evening of 12.1
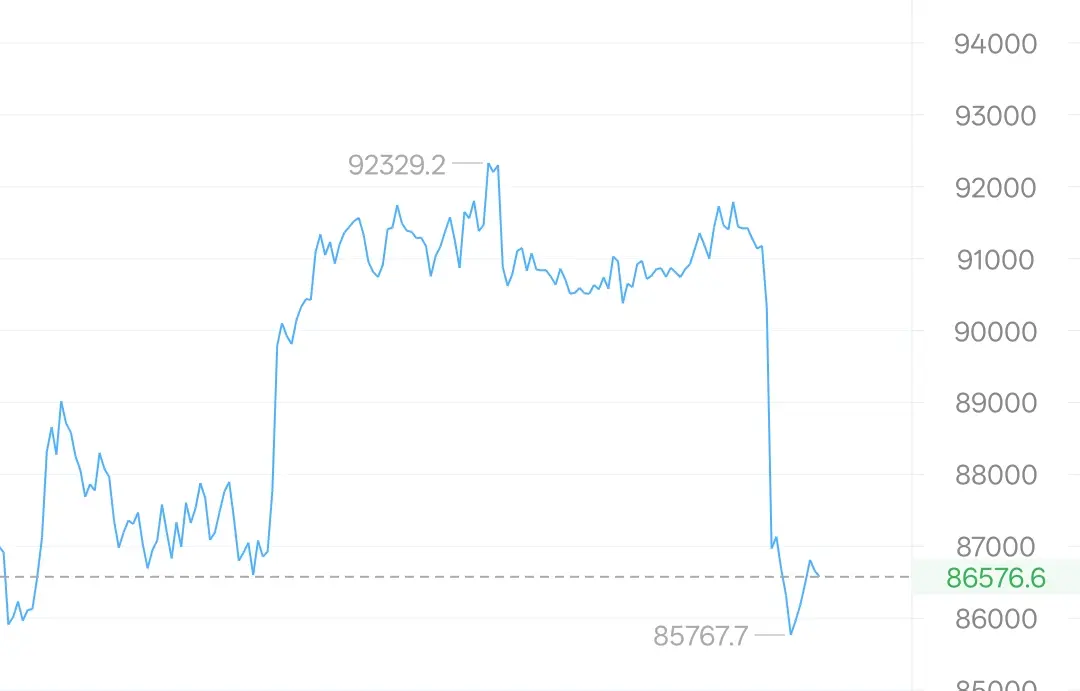
From the 1-hour K-line chart, Bitcoin has experienced a rapid decline in a short period, dropping from 91934.4 to 85563.7, a decrease of about 5.02%; the price trend is currently in a downward trend, with the price oscillating around 86606.7; the lower support level is at 85563.7, and if this position is broken, it may further explore downward. A large bearish candle appeared in the morning, followed by small bearish and bullish candles, indicating strong bearish pressure, but there is some resistance from the bulls. It has broken through the middle band of the Bollinger Bands
View OriginalFrom the 1-hour K-line chart, Bitcoin has experienced a rapid decline in a short period, dropping from 91934.4 to 85563.7, a decrease of about 5.02%; the price trend is currently in a downward trend, with the price oscillating around 86606.7; the lower support level is at 85563.7, and if this position is broken, it may further explore downward. A large bearish candle appeared in the morning, followed by small bearish and bullish candles, indicating strong bearish pressure, but there is some resistance from the bulls. It has broken through the middle band of the Bollinger Bands
- Reward
- 2
- 3
- Repost
- Share
AAChenHaoyu:
333View More
12.1 Morning
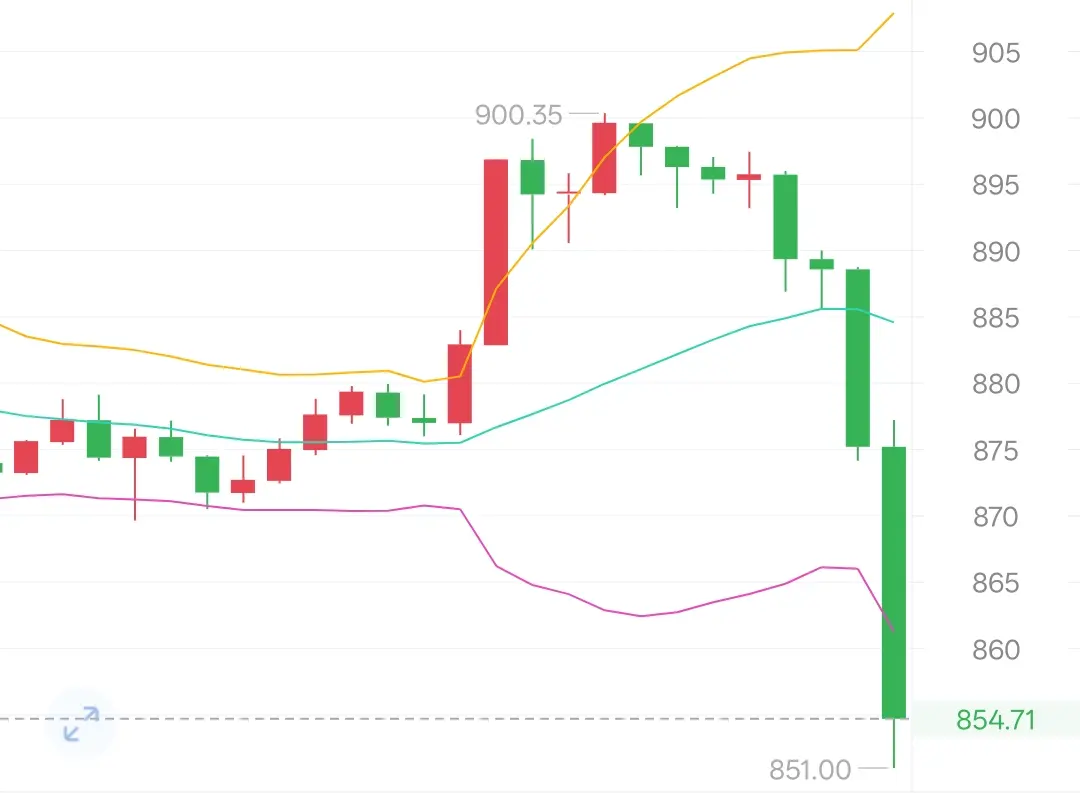
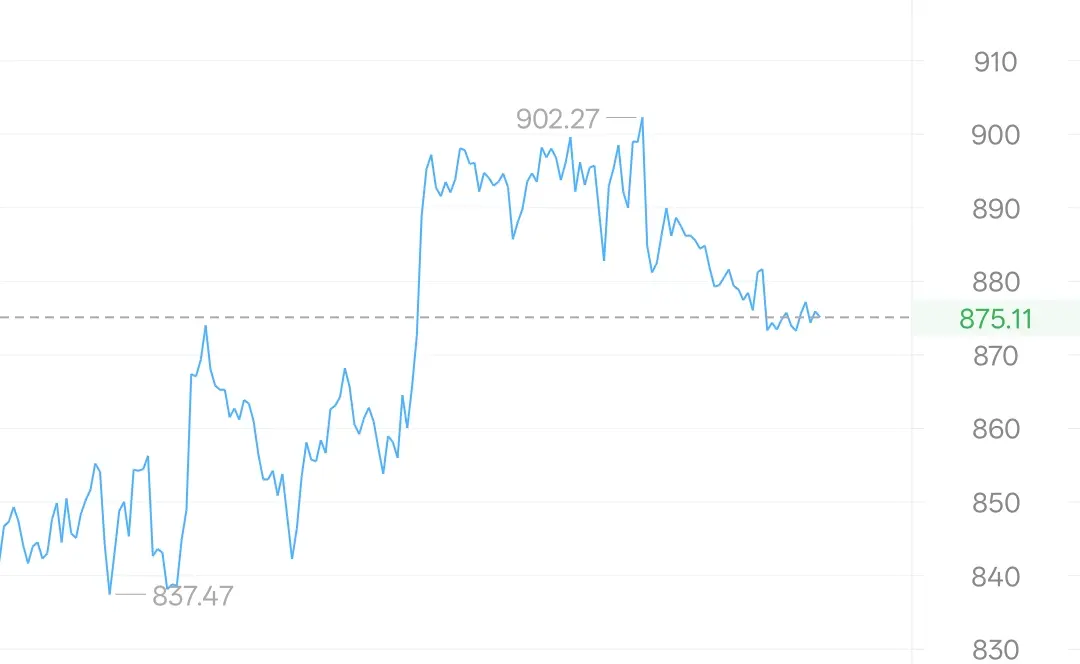
After encountering resistance near 900.35, BNB formed a long bearish candlestick, indicating strong selling pressure above; it then quickly dropped to around 874.16 and is currently in a low-level consolidation state.
Currently, after breaking below the middle track of 885.61, support is found near the lower track of the Bollinger Bands at 866.13.
The KDJ indicator's J value is at a low level, indicating signs of being oversold, with the possibility of a short-term rebound.
MACD Indicator: DIF is below DEA, and the MACD histogram is in green, indicating that short-term bearish
BNB-5.74%
- Reward
- 2
- Comment
- Repost
- Share
12.1 morning
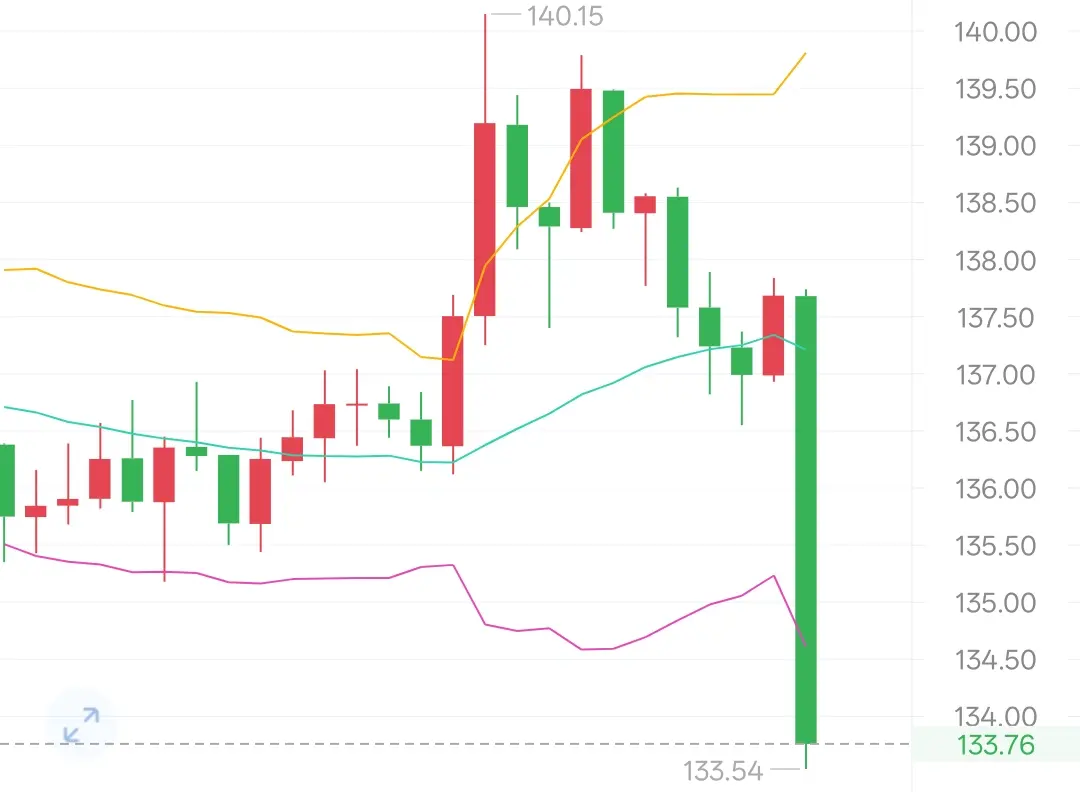
After encountering resistance near 140.15, SOL formed a long bearish candlestick, indicating strong selling pressure above. The price then quickly dropped to around 134.88 and is currently in a low-level consolidation phase. After briefly breaking below the mid-band at 137.28, it found support near the lower band at 134.98.
The KDJ indicator's J value is at a low level, showing signs of being oversold, and there is a possibility of a short-term rebound.
MACD Indicator: DIF is below DEA, and the MACD histogram is green, indicating that short-term bearish strength is still domin
View OriginalAfter encountering resistance near 140.15, SOL formed a long bearish candlestick, indicating strong selling pressure above. The price then quickly dropped to around 134.88 and is currently in a low-level consolidation phase. After briefly breaking below the mid-band at 137.28, it found support near the lower band at 134.98.
The KDJ indicator's J value is at a low level, showing signs of being oversold, and there is a possibility of a short-term rebound.
MACD Indicator: DIF is below DEA, and the MACD histogram is green, indicating that short-term bearish strength is still domin
- Reward
- 3
- 1
- Repost
- Share
MigrantWorkersOnTheC :
:
Steadfast HODL💎12.1 Morning
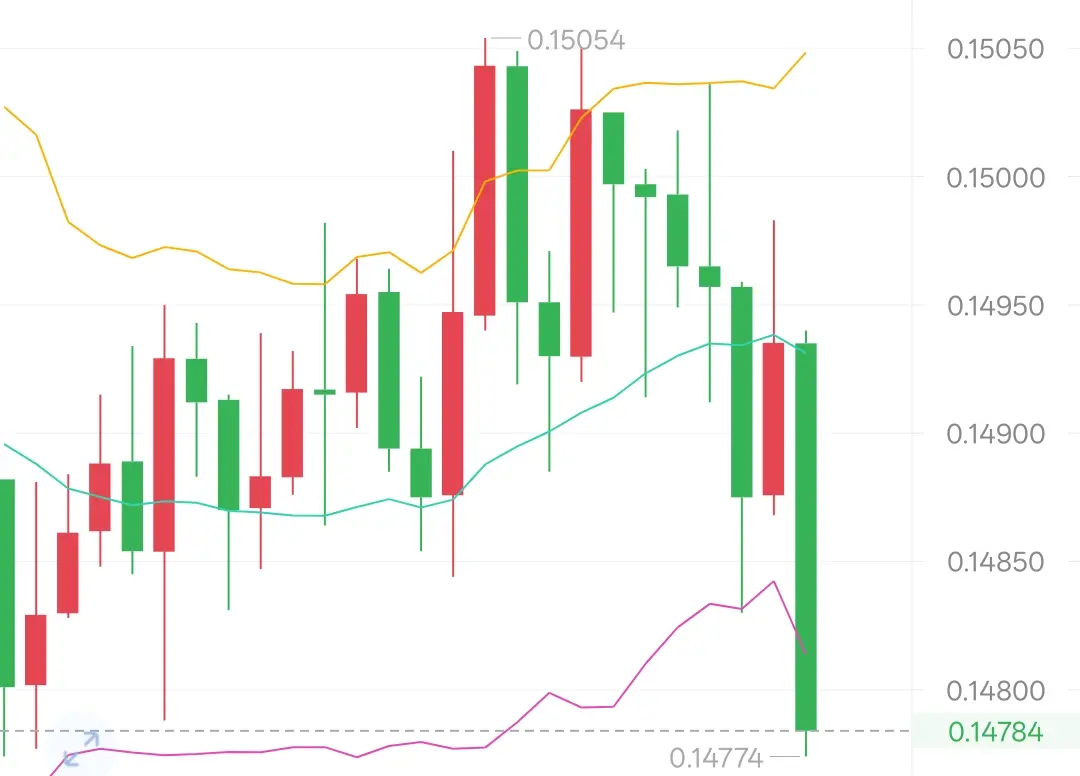
Doge encountered resistance near 0.1505, followed by a long bearish candlestick, indicating strong selling pressure above; then the price quickly dipped to around 0.1477, currently in a low-level consolidation state. After breaking below the middle band at 0.1493, it found support near the lower band at 0.1481.
The KDJ indicator's J value is at a low level, showing signs of being oversold, indicating the possibility of a short-term rebound.
MACD Indicator: DIF is below DEA, and the MACD bars are green, indicating that short-term bearish strength still prevails.
In the short te
DOGE-7.34%
MC:$4.23KHolders:728
0.07%
- Reward
- 5
- 11
- Repost
- Share
GateUser-87c98f5b :
:
Thank you for the valuable information.View More
12.1 Morning
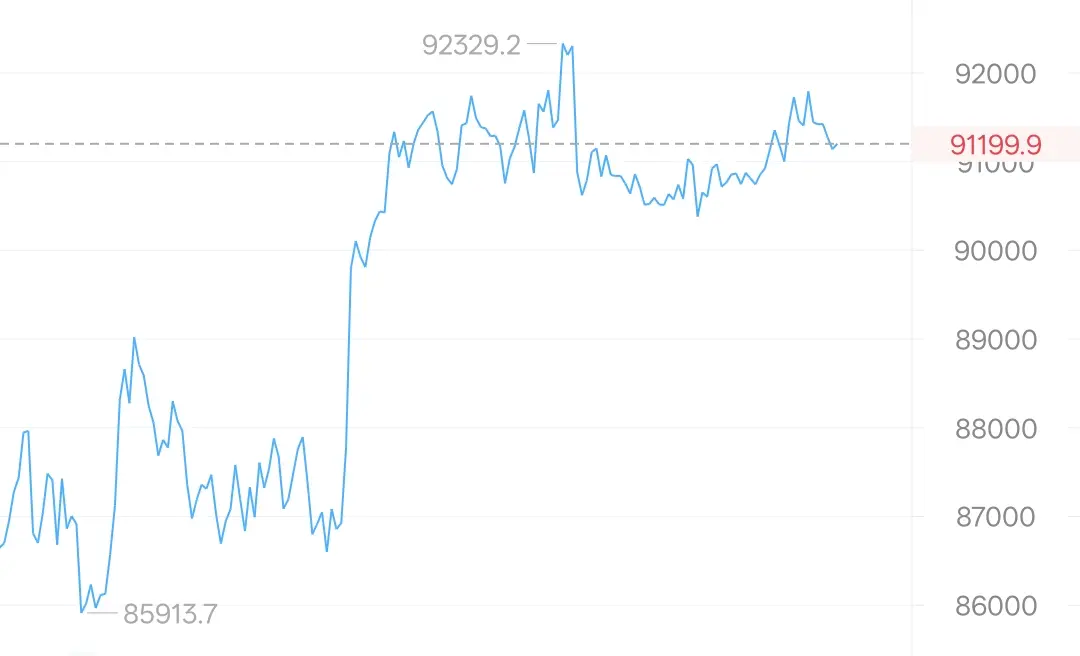
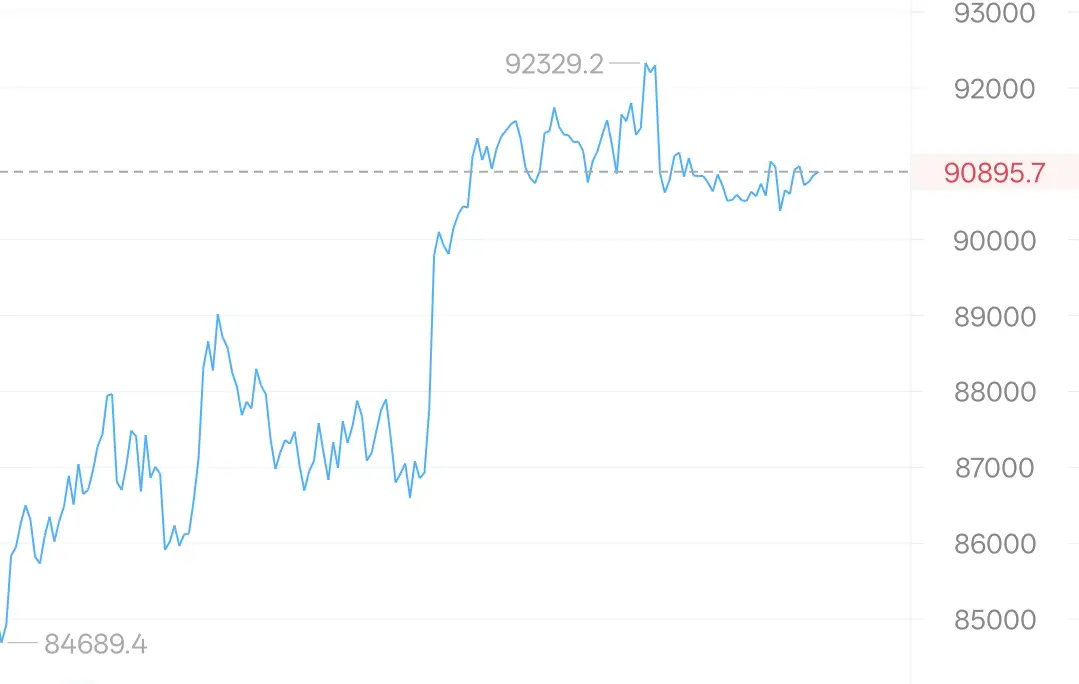
Bitcoin is currently around the 91169 level, recently showing a spike and then a pullback. The price faced resistance near 91934.4 and subsequently retraced. This spike and pullback candlestick is a "inverted hammer" or "shooting star" pattern, indicating strong selling pressure above; the subsequent few candlesticks show a consolidation phase, with both bulls and bears temporarily in a state of equilibrium.
The Bollinger Bands indicator shows that it is operating near the middle band, which provides certain support to the price.
The J value in the KDJ indicator is at a low level,
View OriginalBitcoin is currently around the 91169 level, recently showing a spike and then a pullback. The price faced resistance near 91934.4 and subsequently retraced. This spike and pullback candlestick is a "inverted hammer" or "shooting star" pattern, indicating strong selling pressure above; the subsequent few candlesticks show a consolidation phase, with both bulls and bears temporarily in a state of equilibrium.
The Bollinger Bands indicator shows that it is operating near the middle band, which provides certain support to the price.
The J value in the KDJ indicator is at a low level,
- Reward
- 5
- 1
- Repost
- Share
GateUser-15bb61e5:
that's great I have never seen this beforeNovember 30 evening
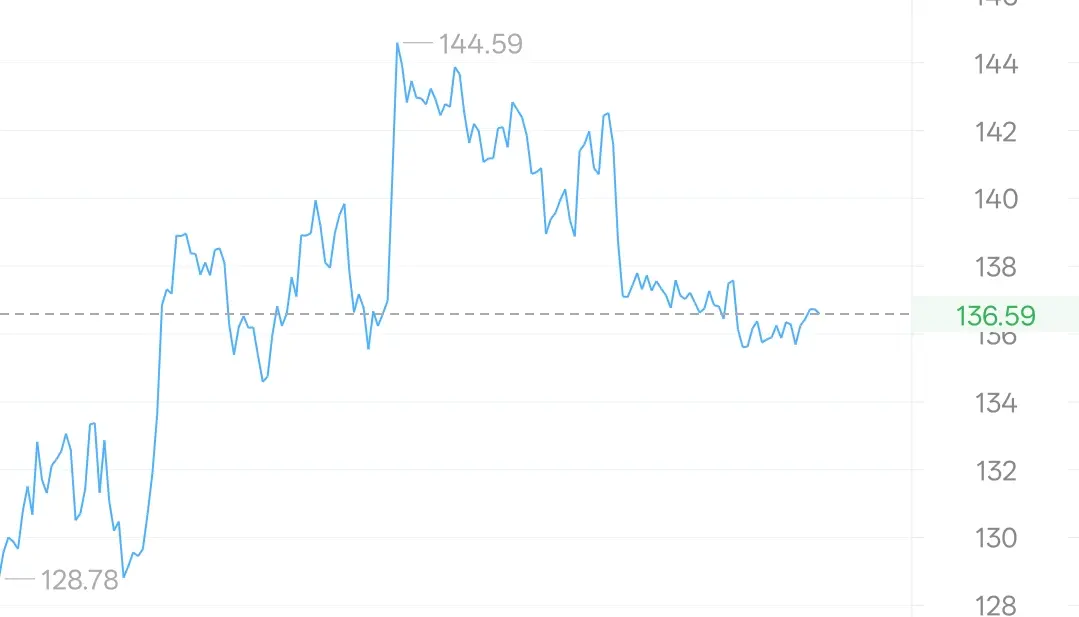
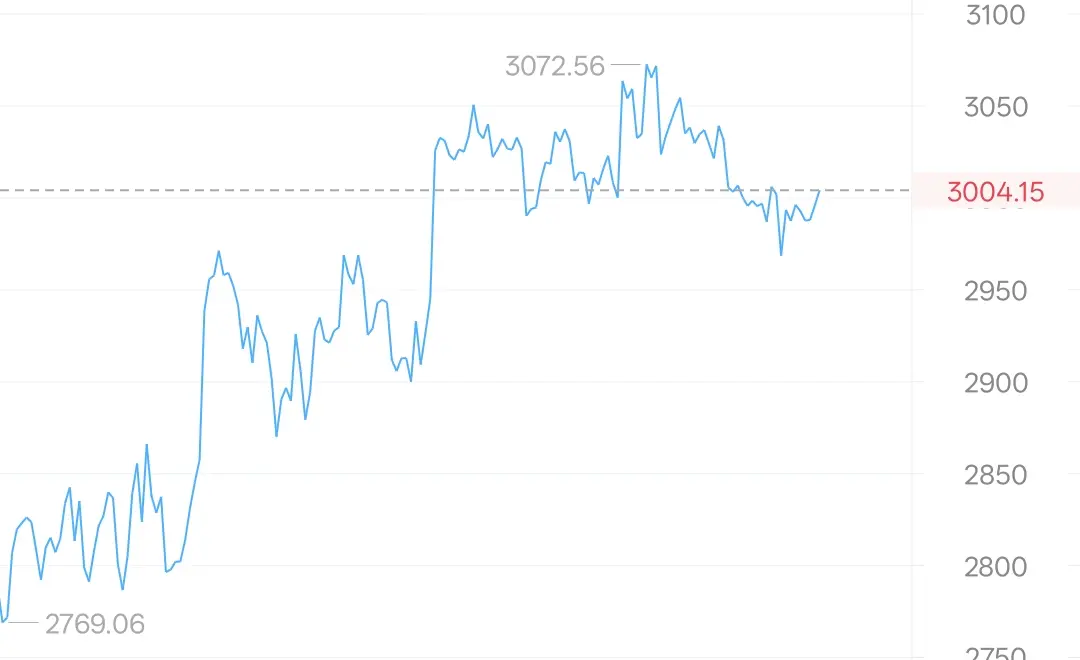
SOL is currently around the 136.6 position. Observing the 1-hour chart, it is in a phase of consolidation, with the candlesticks alternating between red and green, showing no obvious trend direction. Currently, it is oscillating near the middle band of the Bollinger Bands, with a neutral trend; the three lines of the KDJ are all in a high position, indicating a risk of overbought.
MACD: DIF crosses above DEA, the histogram turns red, and bullish momentum has strengthened.
The short-term trend analysis indicates a consolidation phase, with relatively balanced bullish and bea
SOL-5.94%
- Reward
- 1
- Comment
- Repost
- Share
11.30
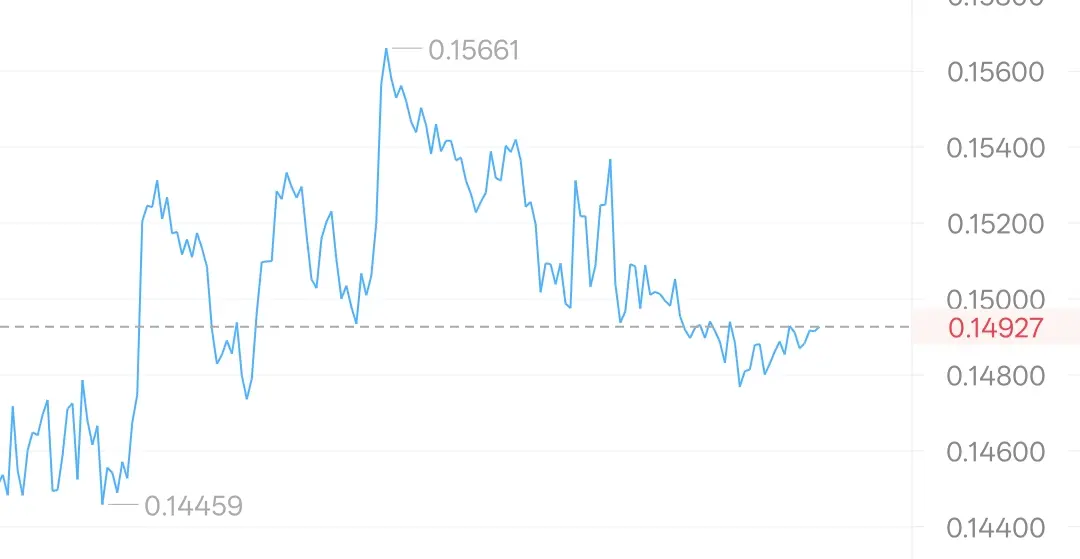
Doge is currently around the position of 0.1493. Observing from the 1-hour level, the price is in a low-level fluctuation, with small ups and downs. The candlestick chart shows an alternating pattern of red and green, with no obvious trend direction.
Oscillating between the middle and upper bands of the Bollinger Bands, the trend is neutral.
The KDJ three lines are all at a medium to high level, showing slight signs of overbought.
The MACD histogram is very small, indicating a balance between bullish and bearish forces.
In the short term, it is in a stage of consolidation with relatively
DOGE-7.34%
- Reward
- 1
- 1
- Repost
- Share
MoneyLake :
:
The lines are drawn by the market manipulators for the suckers to see, which is of little significance🤔11.30
Bitcoin is currently near the position of 91459. Observing from the 1-hour chart, there is a clear large bullish candlestick that has broken through the upper Bollinger Band. This large bullish candlestick, accompanied by an increase in trading volume, indicates strong short-term bullish momentum, placing it in a short-term strong zone.
The KDJ indicator's three lines are all at high levels, indicating a risk of overbought conditions; the MACD histogram has turned red, signaling an increase in bullish momentum.
The price is in a short-term rebound phase, dominated by bullish forces.
View OriginalBitcoin is currently near the position of 91459. Observing from the 1-hour chart, there is a clear large bullish candlestick that has broken through the upper Bollinger Band. This large bullish candlestick, accompanied by an increase in trading volume, indicates strong short-term bullish momentum, placing it in a short-term strong zone.
The KDJ indicator's three lines are all at high levels, indicating a risk of overbought conditions; the MACD histogram has turned red, signaling an increase in bullish momentum.
The price is in a short-term rebound phase, dominated by bullish forces.
- Reward
- 1
- Comment
- Repost
- Share
11.30
BNB is currently around 874.9, and is in a state of fluctuating downward movement within the 1-hour period. The recent candlestick pattern shows a "red and green alternation"; the candlestick body is larger during declines and smaller during increases, indicating a slight advantage for the bears. It is operating below the middle band of the Bollinger Bands, showing that the market is in a weak consolidation state.
The KDJ indicator shows that the three lines are diverging upwards, indicating a short-term demand for a rebound.
MACD Indicator: DIF and DEA are still in the negative value ar
BNB-5.74%
- Reward
- 1
- Comment
- Repost
- Share
11.30
The current price of SOL is around 136.4, and in the 1-hour timeframe, the price is in a state of oscillating downward. The most recent candlestick shows the characteristics of "red fat and green thin"; the candlestick body is larger when falling and smaller when rising. This indicates that the bearish forces have a slight advantage. It is currently running near the middle track of the Bollinger Bands, indicating that the market is in a state of oscillation.
KDJ Indicator: The J value is approaching the overbought zone, the K line and D line are diverging upwards, indicating a short-term
SOL-5.94%

- Reward
- 1
- Comment
- Repost
- Share
11.30
Doge is currently around the 0.149 position, showing a slight rebound from recent lows; overall, it is in a recent downtrend, with weak rebound strength; it is currently operating near the middle band of the Bollinger Bands, with the upper and lower bands narrowing, indicating a decrease in short-term volatility; recent candlesticks show alternating small bodies of red and green, indicating a tug-of-war between bulls and bears; however, the overall trend still leans towards bearish, with no clear reversal signal yet.
The KDJ indicator's J line has entered the overbought zone close to
DOGE-7.34%

- Reward
- 1
- 1
- Repost
- Share
GateUser-1994b681:
yes11.30
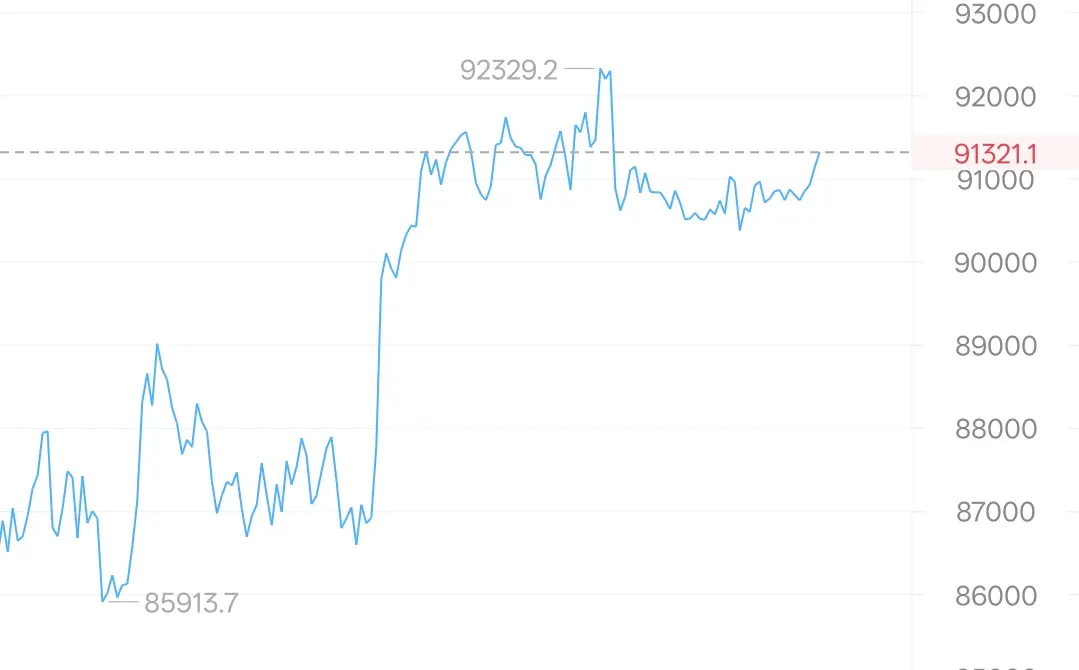
The large coin is currently near the position of 90904; however, the daily fluctuations are small, and it is overall in a narrow consolidation state; in the short term, it is operating near the middle track of the Bollinger Bands, with the upper and lower track spaces narrowing, indicating a decrease in short-term volatility; the recent few candlesticks show a pattern of small entities alternating between red and green, which indicates that the short-term bullish and bearish forces are in a tug-of-war state, with no obvious directional breakthrough.
The KDJ indicator's three lines ar
View OriginalThe large coin is currently near the position of 90904; however, the daily fluctuations are small, and it is overall in a narrow consolidation state; in the short term, it is operating near the middle track of the Bollinger Bands, with the upper and lower track spaces narrowing, indicating a decrease in short-term volatility; the recent few candlesticks show a pattern of small entities alternating between red and green, which indicates that the short-term bullish and bearish forces are in a tug-of-war state, with no obvious directional breakthrough.
The KDJ indicator's three lines ar

- Reward
- 7
- 5
- 1
- Share
GateUser-618ed836:
😀🤭😀🤭😀🤭😀🤭😀🤭😀🤭😀🤭😀🤭🤭😀🤭😀🤭😀🤭😀🤭😀🤭😀🤭🤭😀🤭😀🤭😀😀🤭😀🤭🤭😀🤭😀😀🤭🤭😀🤭😀😀🤭😀🤭🤭😀😀🤭🤭😀😀🤭😀🤭🤭😀🤭😀😀🤭😀🤭😀🤭View More
Market fluctuations are like the ups and downs of life. Those pullbacks in the Candlesticks are merely the buildup before a trend starts. Every fluctuation you endure is paving the way for the next wave of profits. Stick to your analysis and judgment; time will give you the answer. $BNB
BNB-5.74%

- Reward
- 1
- Comment
- Repost
- Share
There are no everlasting smooth paths in investment, but there are always strong players. Even if there is indicator divergence and price pressure at this moment, do not forget the expertise you have accumulated and the confidence from your reviews. Every calm response brings you closer to profit $BTC $ETH .
View Original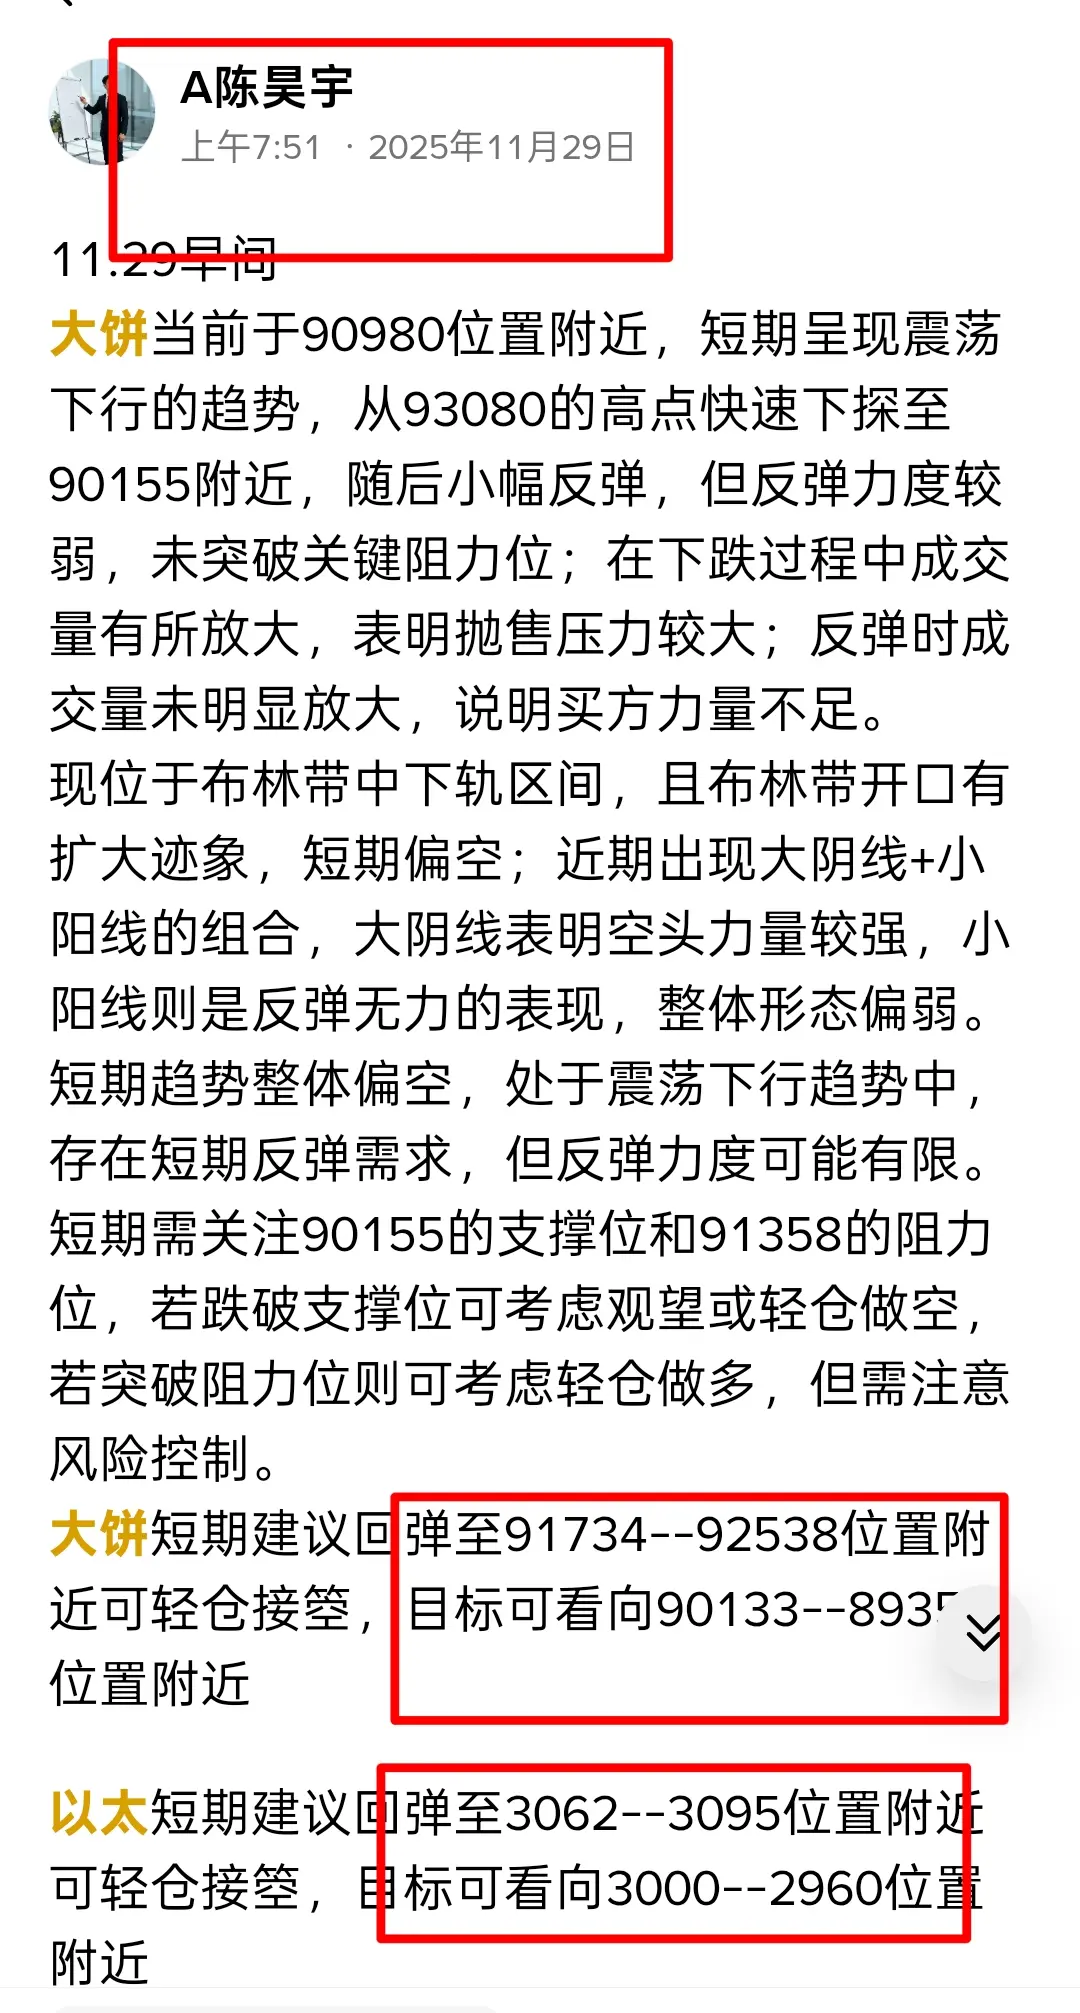

- Reward
- 1
- Comment
- Repost
- Share
11.29midday
The pancake is currently oscillating around the position of 90471, in a pullback phase, running between the middle and lower bands of the Bollinger Bands indicator, and approaching the lower band. Recently, the K-line has shown a pattern of alternating small real body bearish and bullish candles, indicating fierce competition between bulls and bears, with unclear short-term direction; this pattern is also known as "consolidation", which usually occurs during the adjustment phase of a trend.
KDJ Indicator: Both the K line and D line are below 50, and the J line is at the bottom, ind
View OriginalThe pancake is currently oscillating around the position of 90471, in a pullback phase, running between the middle and lower bands of the Bollinger Bands indicator, and approaching the lower band. Recently, the K-line has shown a pattern of alternating small real body bearish and bullish candles, indicating fierce competition between bulls and bears, with unclear short-term direction; this pattern is also known as "consolidation", which usually occurs during the adjustment phase of a trend.
KDJ Indicator: Both the K line and D line are below 50, and the J line is at the bottom, ind


- Reward
- 2
- Comment
- Repost
- Share
11.29midday
The pancake is currently oscillating around the position of 90471, in a pullback phase, running between the middle and lower bands of the Bollinger Bands indicator, and approaching the lower band. Recently, the K-line has shown a pattern of alternating small real body bearish and bullish candles, indicating fierce competition between bulls and bears, with unclear short-term direction; this pattern is also known as "consolidation", which usually occurs during the adjustment phase of a trend.
KDJ Indicator: Both the K line and D line are below 50, and the J line is at the bottom, ind
View OriginalThe pancake is currently oscillating around the position of 90471, in a pullback phase, running between the middle and lower bands of the Bollinger Bands indicator, and approaching the lower band. Recently, the K-line has shown a pattern of alternating small real body bearish and bullish candles, indicating fierce competition between bulls and bears, with unclear short-term direction; this pattern is also known as "consolidation", which usually occurs during the adjustment phase of a trend.
KDJ Indicator: Both the K line and D line are below 50, and the J line is at the bottom, ind

- Reward
- 2
- 3
- Repost
- Share
PlayingWithCoinsIsAlsoCrazy :
:
66666666(●—●)。😁😁😁😁😁😁😁😁😁😁😁😁😁😁😁😁😊😊☺️☺️☺️☺️☺️☺️View More
Evening review, there are no eternal favorable conditions on the investment road, but there are always strong individuals. Even if the indicator divergence and price pressure are present at this moment, do not forget the expertise you have accumulated and the confidence from your reviews. Every calm response brings you closer to profit. $BTC $ETH #成长值抽奖赢iPhone17和周边
View Original

- Reward
- 1
- Comment
- Repost
- Share