


ETH Today's Wealth Sharing
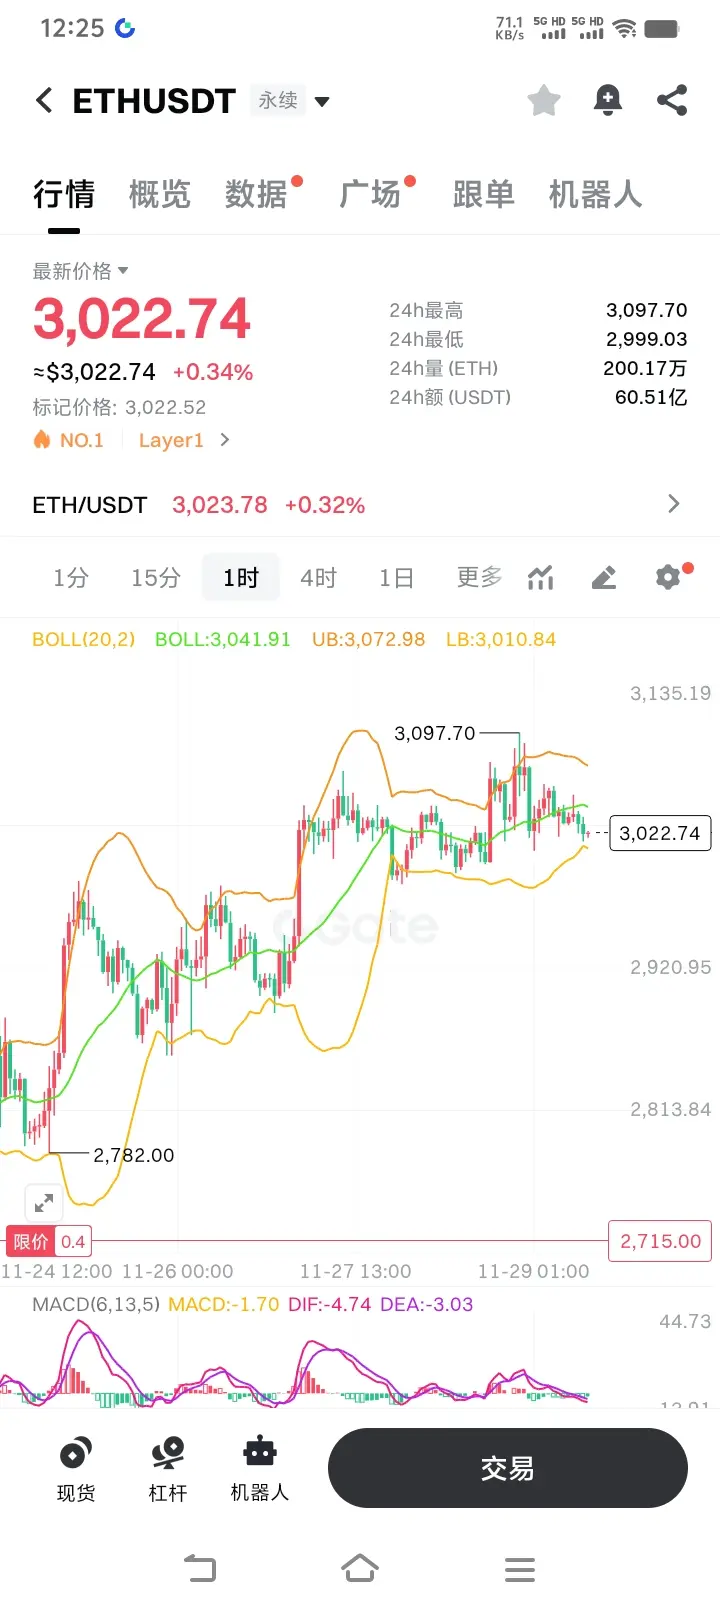
[Price Trend Analysis]
K-line pattern:
On the 4-hour chart, a long lower shadow tested the 2900 support level (11/25 08:00), but the subsequent bearish candlestick's body engulfed the previous bullish candlestick's rebound range, indicating selling pressure above 2950.
The daily line has pulled back after rising for 2 consecutive days (highest on 11/24 at 2987 → closed at 2953, dropped from 2953 to 2911 on 11/25), forming a short-term top structure.
Technical Indicators:
MACD: 4-hour DIF(2.17) and DEA(-24.18) have flattened after a golden cross, with the
ETH-6.95%