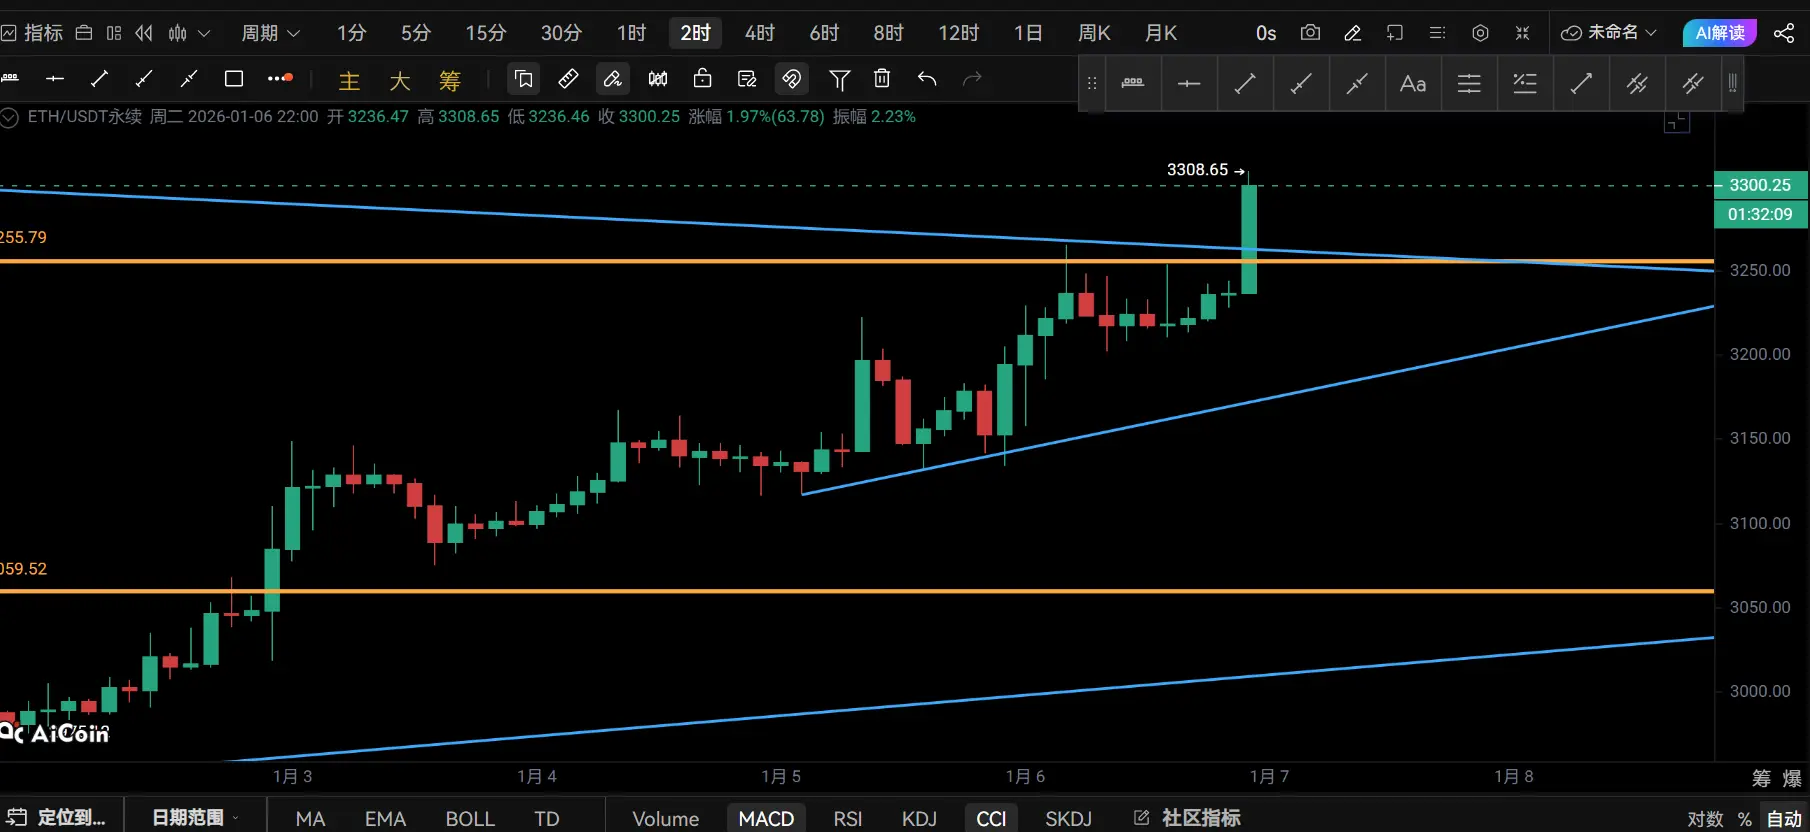
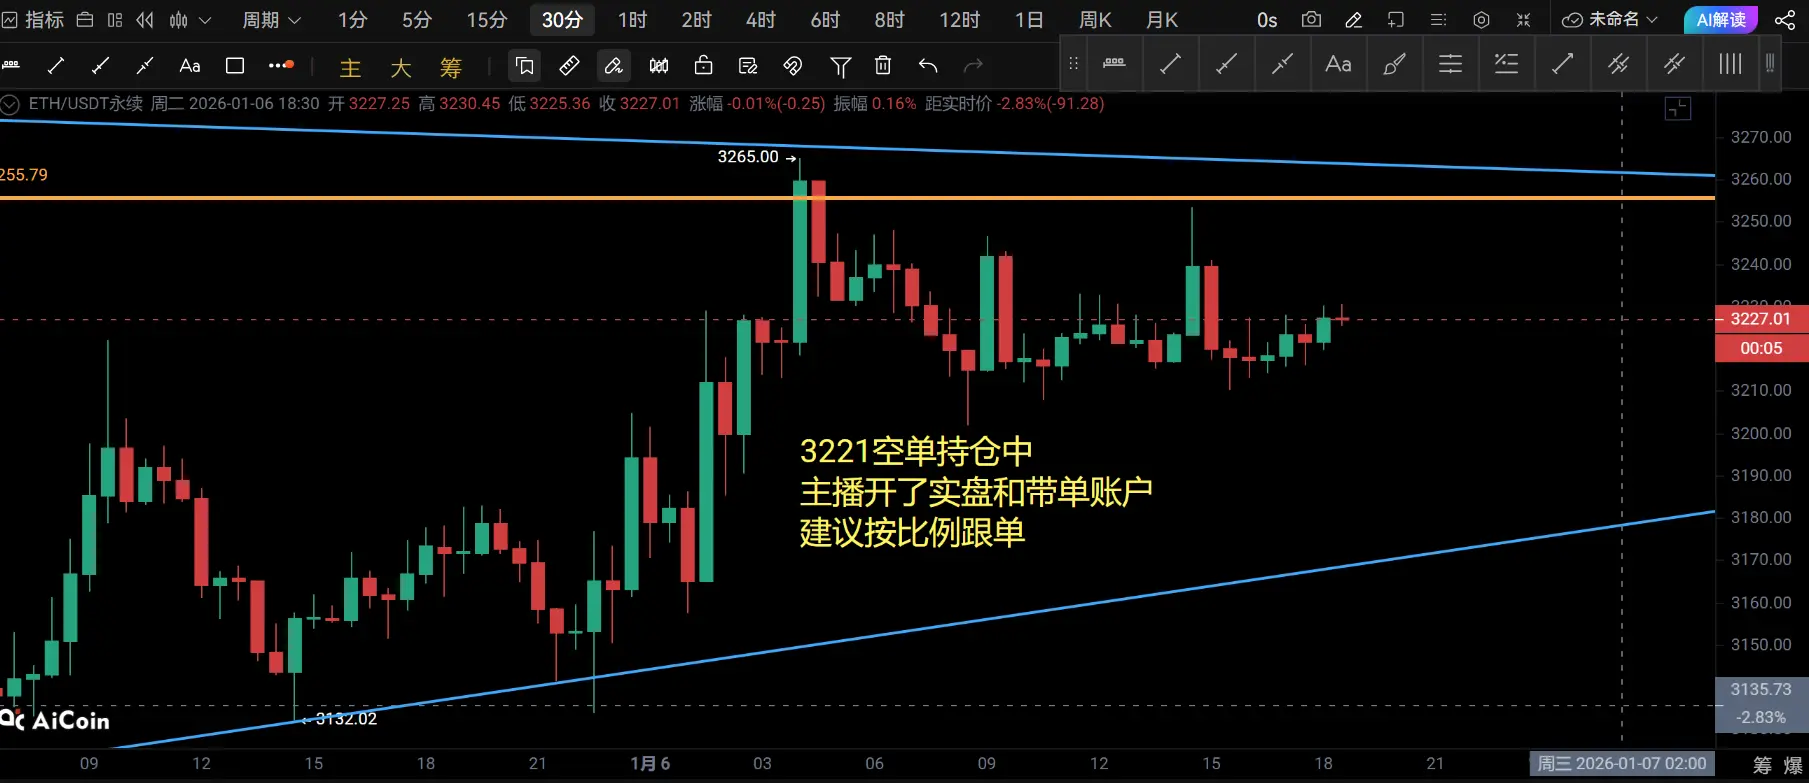
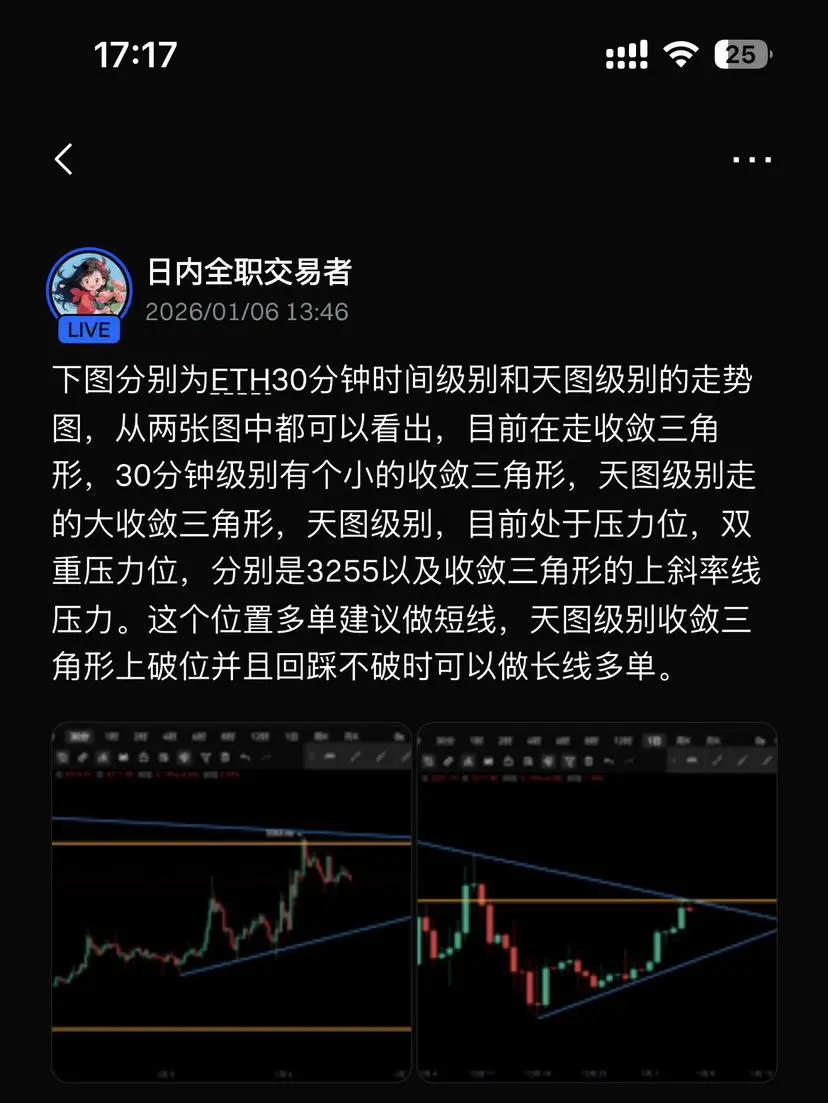
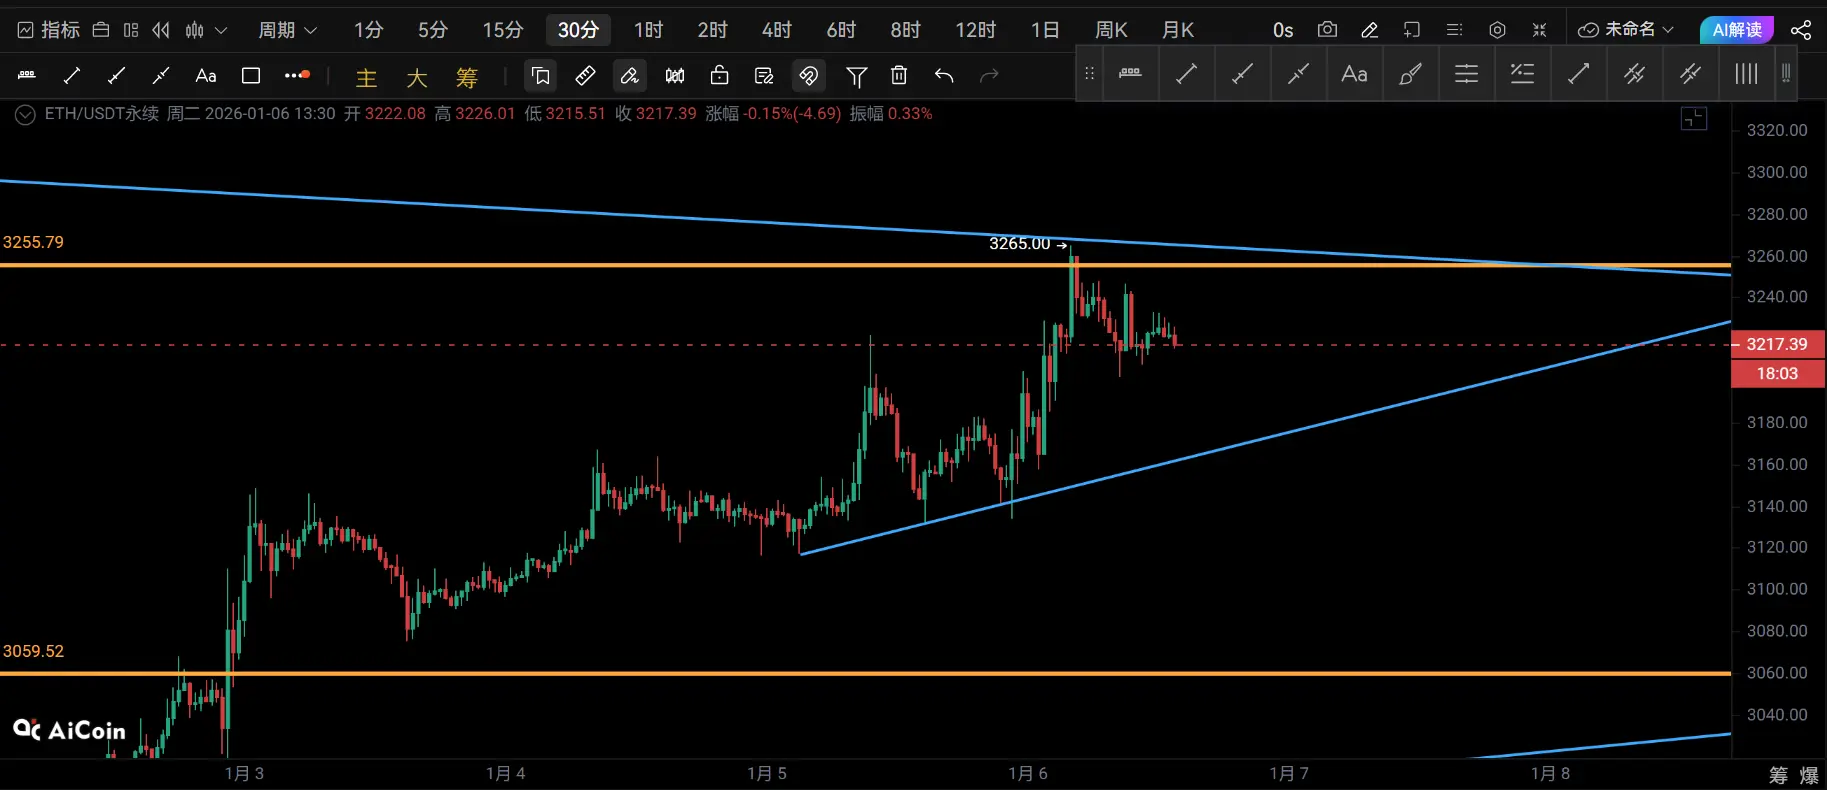
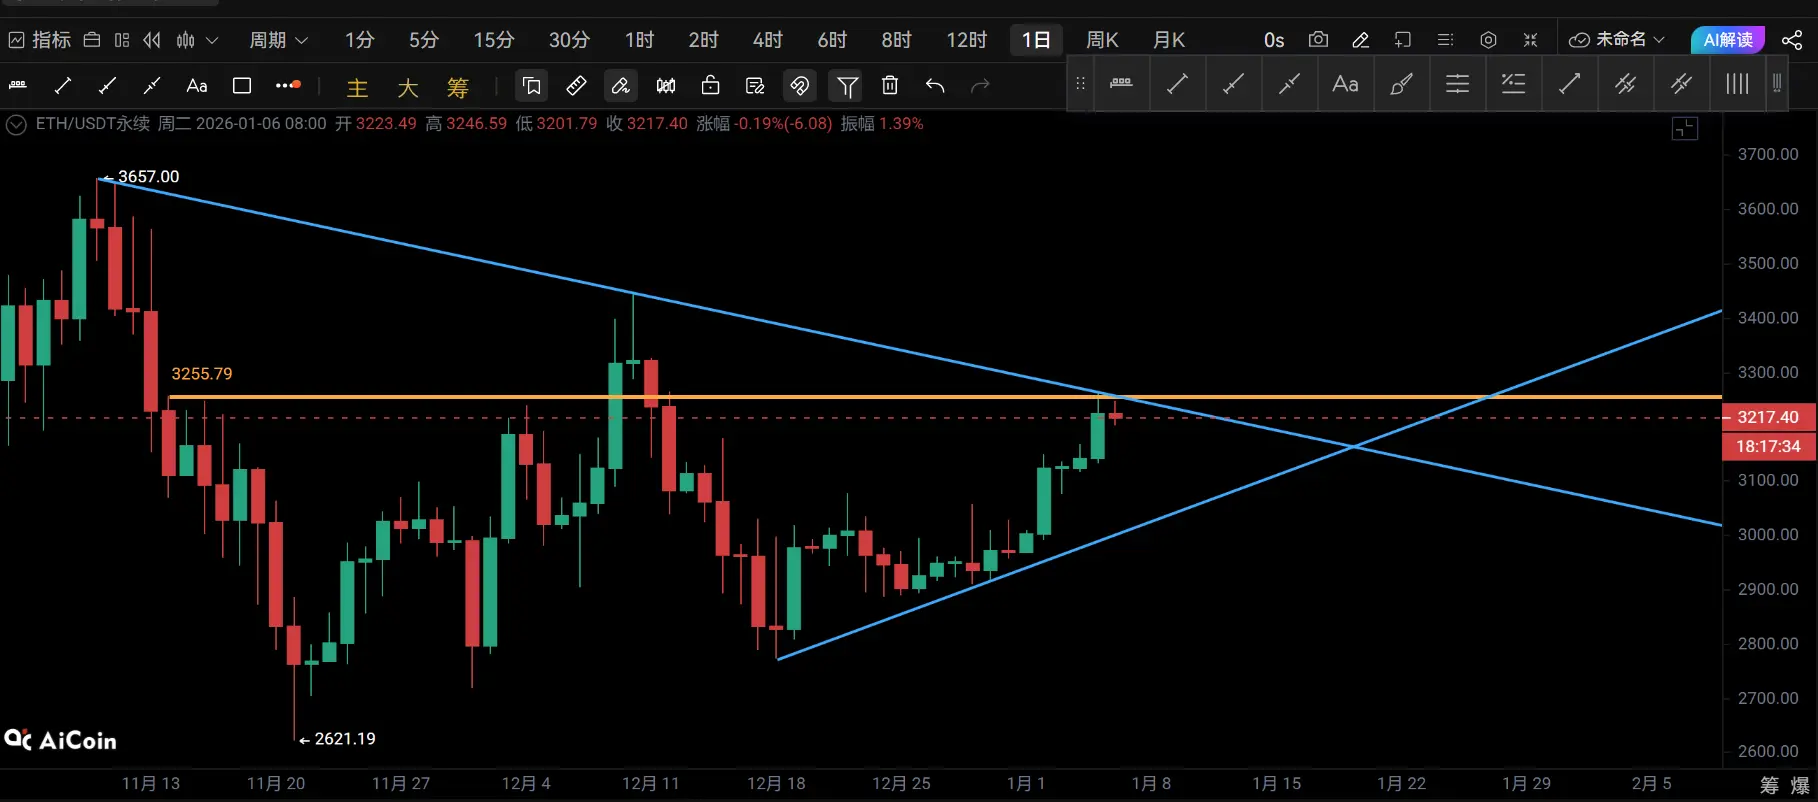
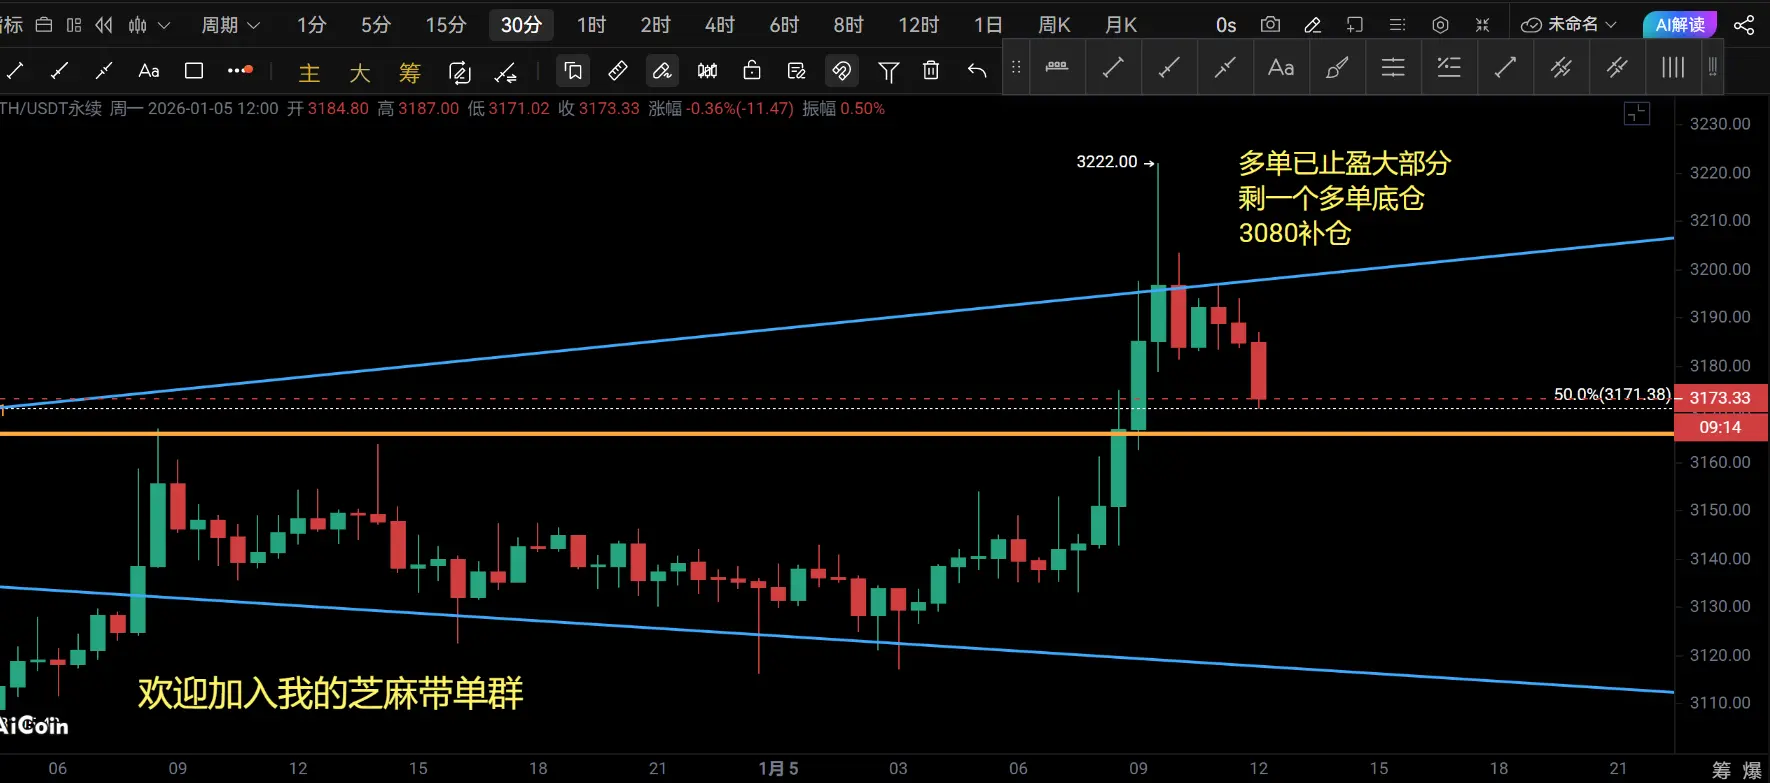
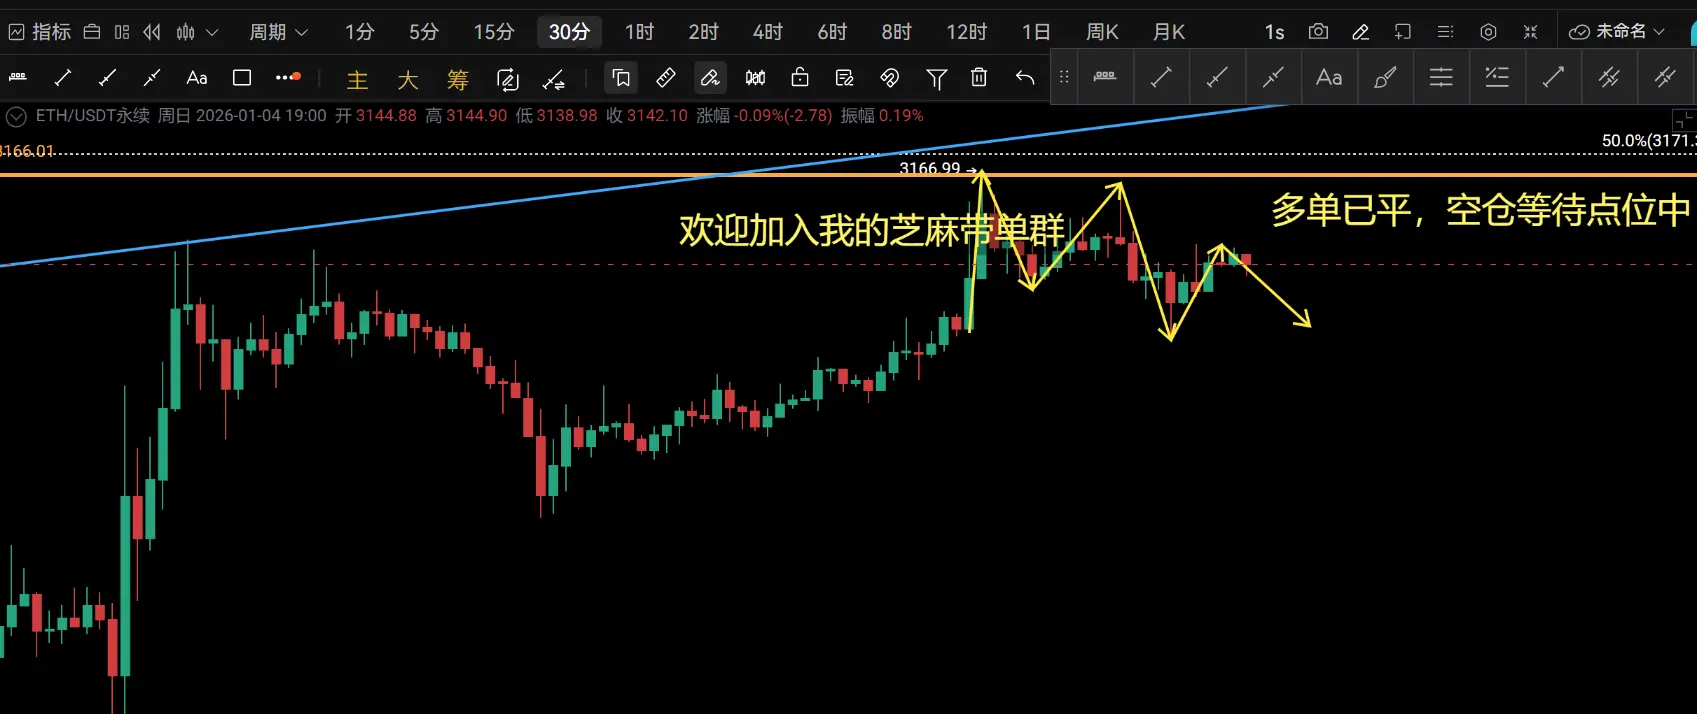
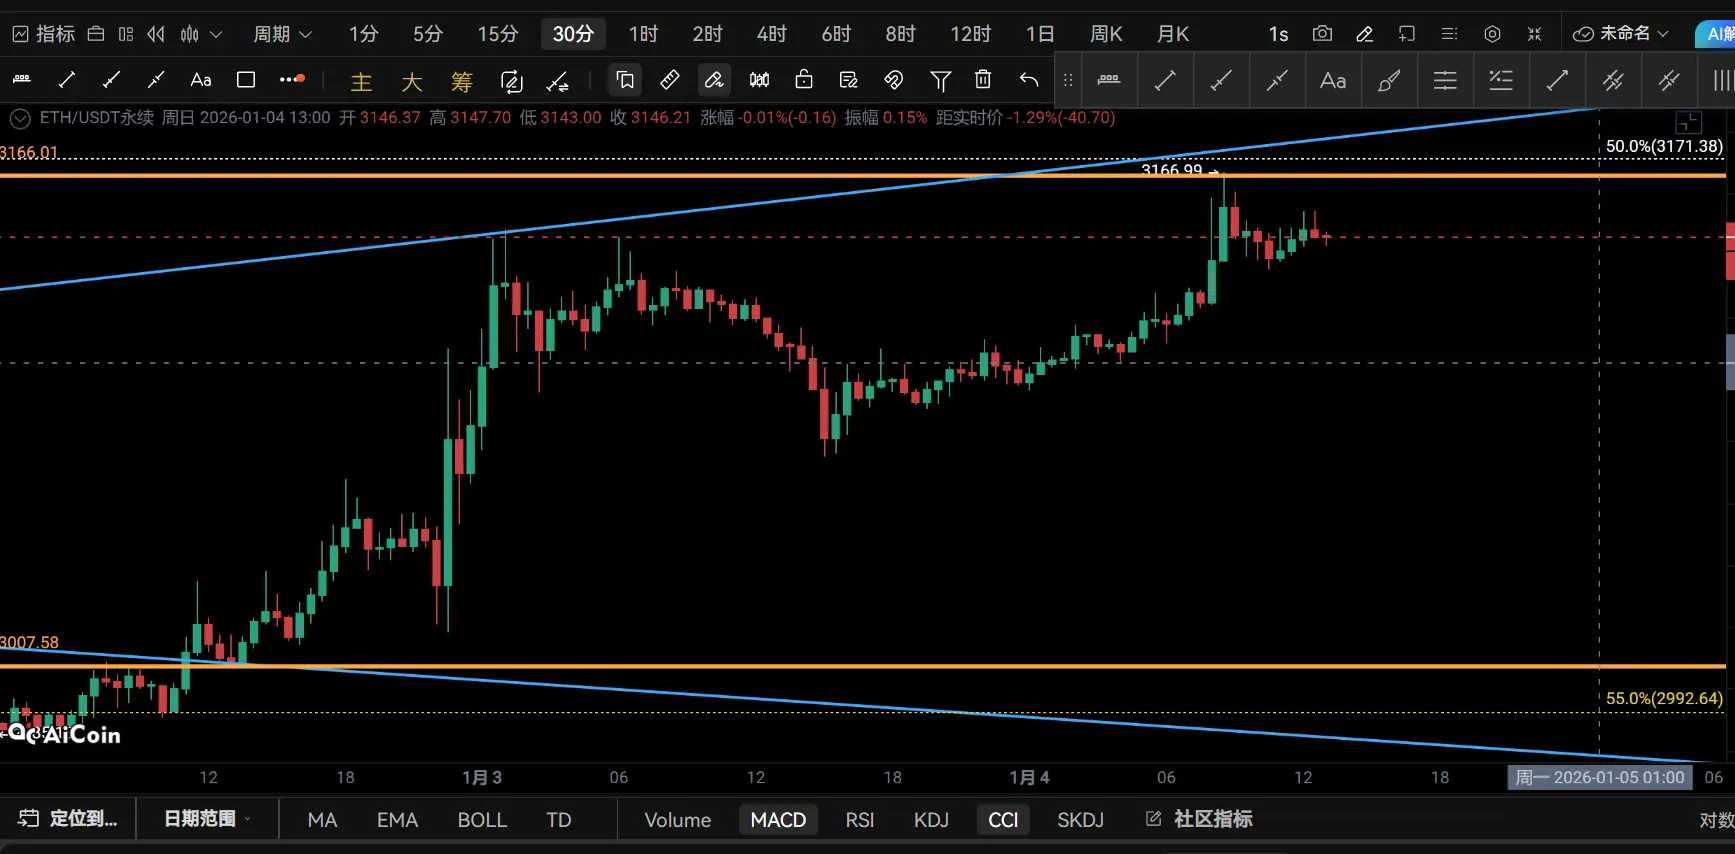
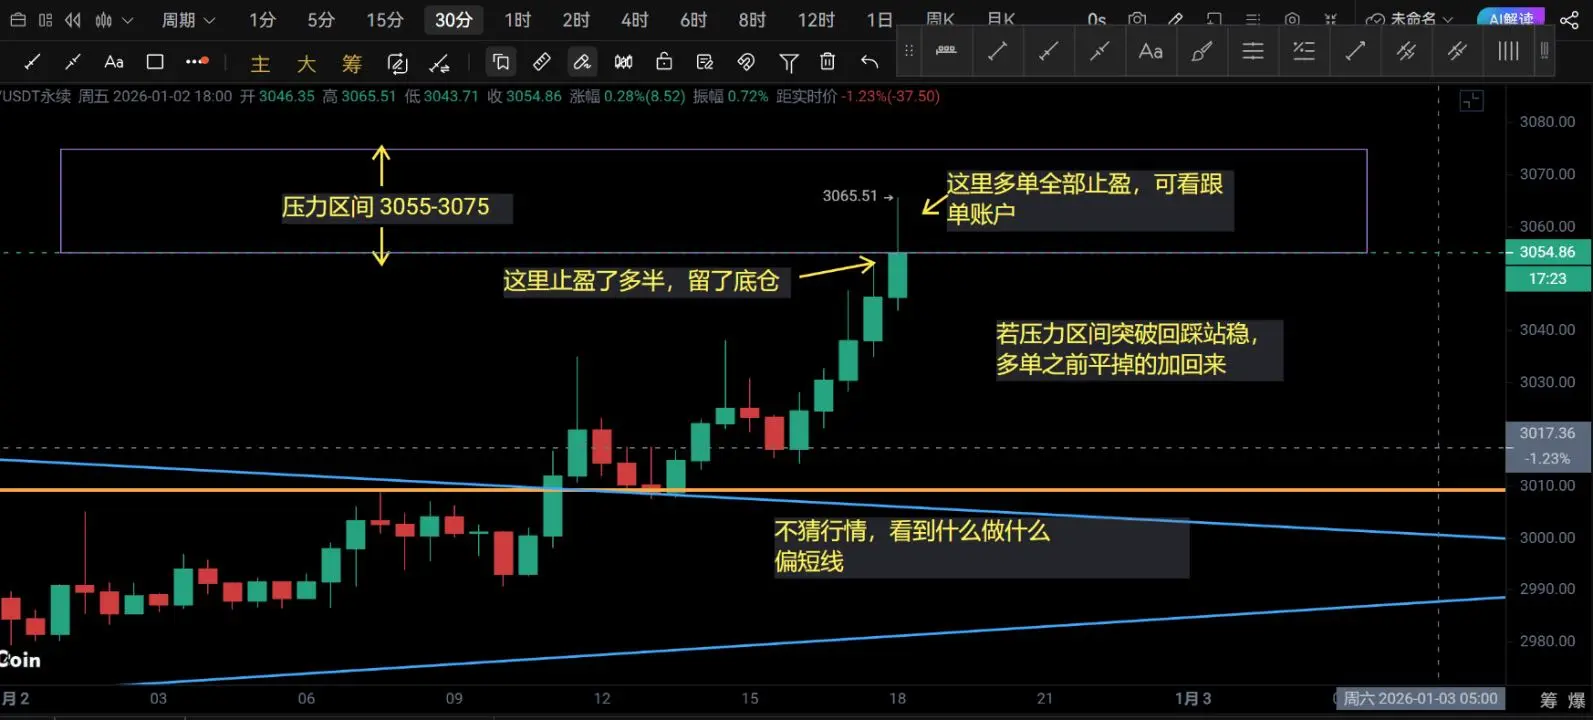
The following images show the ETH 30-minute timeframe and the daily chart. Both charts indicate that a converging triangle is currently forming. On the 30-minute chart, there is a small converging triangle, while on the daily chart, a larger converging triangle is forming. On the daily chart, the price is currently at a resistance level, a double resistance level, which are 3255 and the upper slope line of the converging triangle. At this position, short-term long positions are recommended. If the daily chart's converging triangle breaks above and then retests without breaking below, long-term
View Original