Trade
Basic
Futures
Futures
Hundreds of contracts settled in USDT or BTC
TradFi
Gold
Trade global traditional assets with USDT in one place
Options
Hot
Trade European-style vanilla options
Unified Account
Maximize your capital efficiency
Demo Trading
Futures Kickoff
Get prepared for your futures trading
Futures Events
Participate in events to win generous rewards
Demo Trading
Use virtual funds to experience risk-free trading
Earn
Launch
CandyDrop
Collect candies to earn airdrops
Launchpool
Quick staking, earn potential new tokens
HODLer Airdrop
Hold GT and get massive airdrops for free
Launchpad
Be early to the next big token project
Alpha Points
Trade on-chain assets and enjoy airdrop rewards!
Futures Points
Earn futures points and claim airdrop rewards
Investment
Simple Earn
Earn interests with idle tokens
Auto-Invest
Auto-invest on a regular basis
Dual Investment
Buy low and sell high to take profits from price fluctuations
Soft Staking
Earn rewards with flexible staking
Crypto Loan
0 Fees
Pledge one crypto to borrow another
Lending Center
One-stop lending hub
VIP Wealth Hub
Customized wealth management empowers your assets growth
Private Wealth Management
Customized asset management to grow your digital assets
Quant Fund
Top asset management team helps you profit without hassle
Staking
Stake cryptos to earn in PoS products
Smart Leverage
New
No forced liquidation before maturity, worry-free leveraged gains
GUSD Minting
Use USDT/USDC to mint GUSD for treasury-level yields
More
# AltCoins
1.34M
ELIX
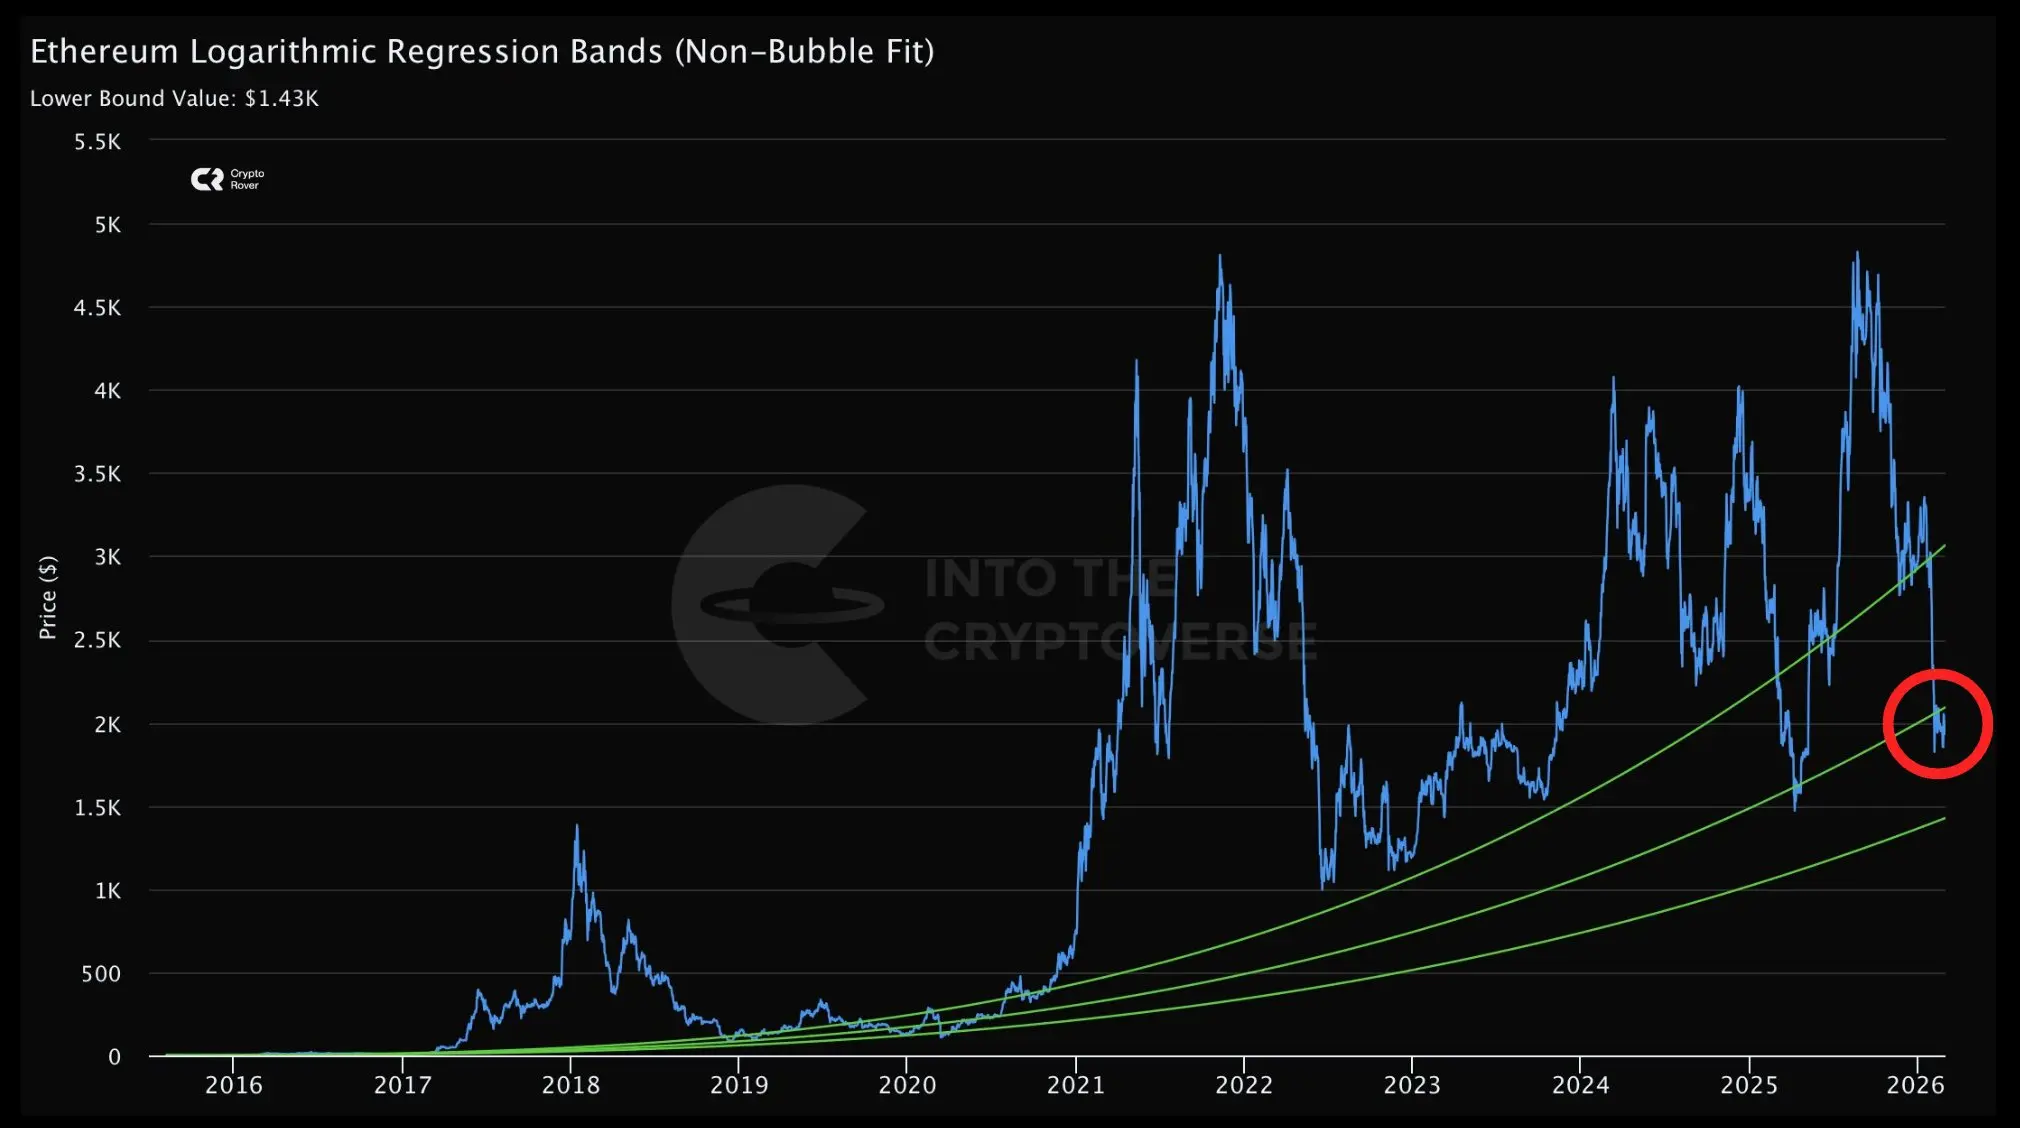
Ethereum is back at a level that has historically mattered.
The logarithmic regression bands show ETH revisiting the lower support zone — an area that has repeatedly acted as long-term value territory. Every major cycle correction has tested this region before the next expansion phase began.
Price is cooling. Sentiment is mixed. Structure remains intact.
When Ethereum trades near the lower regression band, risk-to-reward historically shifts in favor of long-term positioning — not panic.
The red circle isn’t just a dip.
It’s a decision point.
Capitulation zone or accumulation zone?
The next few
ETH2,73%
- Reward
- 3
- 1
- Repost
- Share
GateUser-a49cec94:
Buy to earn 💎Ethereum is back at a level that has historically mattered.
The logarithmic regression bands show ETH revisiting the lower support zone — an area that has repeatedly acted as long-term value territory. Every major cycle correction has tested this region before the next expansion phase began.
Price is cooling. Sentiment is mixed. Structure remains intact.
When Ethereum trades near the lower regression band, risk-to-reward historically shifts in favor of long-term positioning — not panic.
The red circle isn’t just a dip.
It’s a decision point.
Capitulation zone or accumulation zone?
The next few
ETH2,73%

- Reward
- 1
- Comment
- Repost
- Share
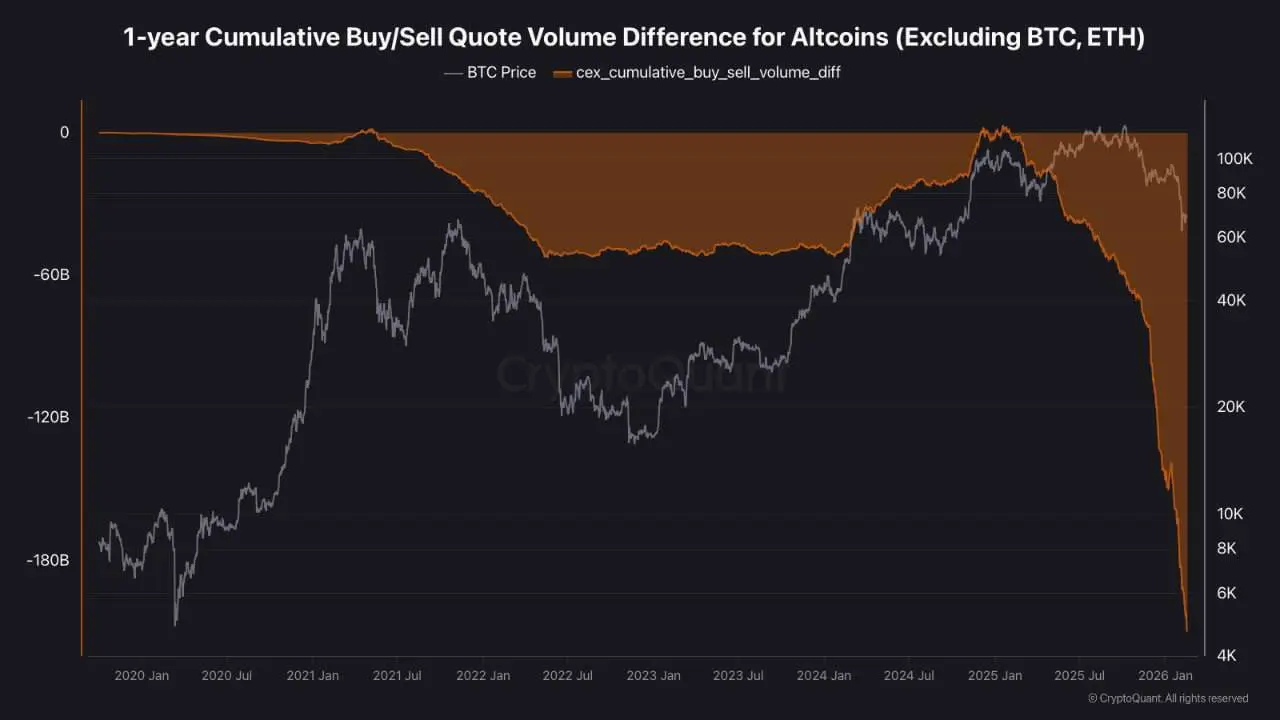
Historic selling pressure on #Altcoins
This needs to stop for a move higher to follow.
For 13 consecutive months, alts have been sold non-stop, with net sell volume hitting $209 billion
#DeepCreationCamp
This needs to stop for a move higher to follow.
For 13 consecutive months, alts have been sold non-stop, with net sell volume hitting $209 billion
#DeepCreationCamp
- Reward
- 1
- Comment
- Repost
- Share
Ethereum is once again approaching a level that has historically carried significant importance in the market cycle.
Data from logarithmic regression bands suggests that ETH is revisiting the lower support region — an area that has repeatedly represented long-term value throughout previous cycles. In past market structures, corrections often tested this zone before the next phase of expansion developed.
At the moment, price action is cooling and overall sentiment across the market is mixed. However, the broader structure of Ethereum still appears stable.
When ETH trades near the lower regressi
ETH2,73%


- Reward
- 5
- 2
- Repost
- Share
ybaser :
:
2026 GOGOGO 👊View More
- Reward
- like
- Comment
- Repost
- Share
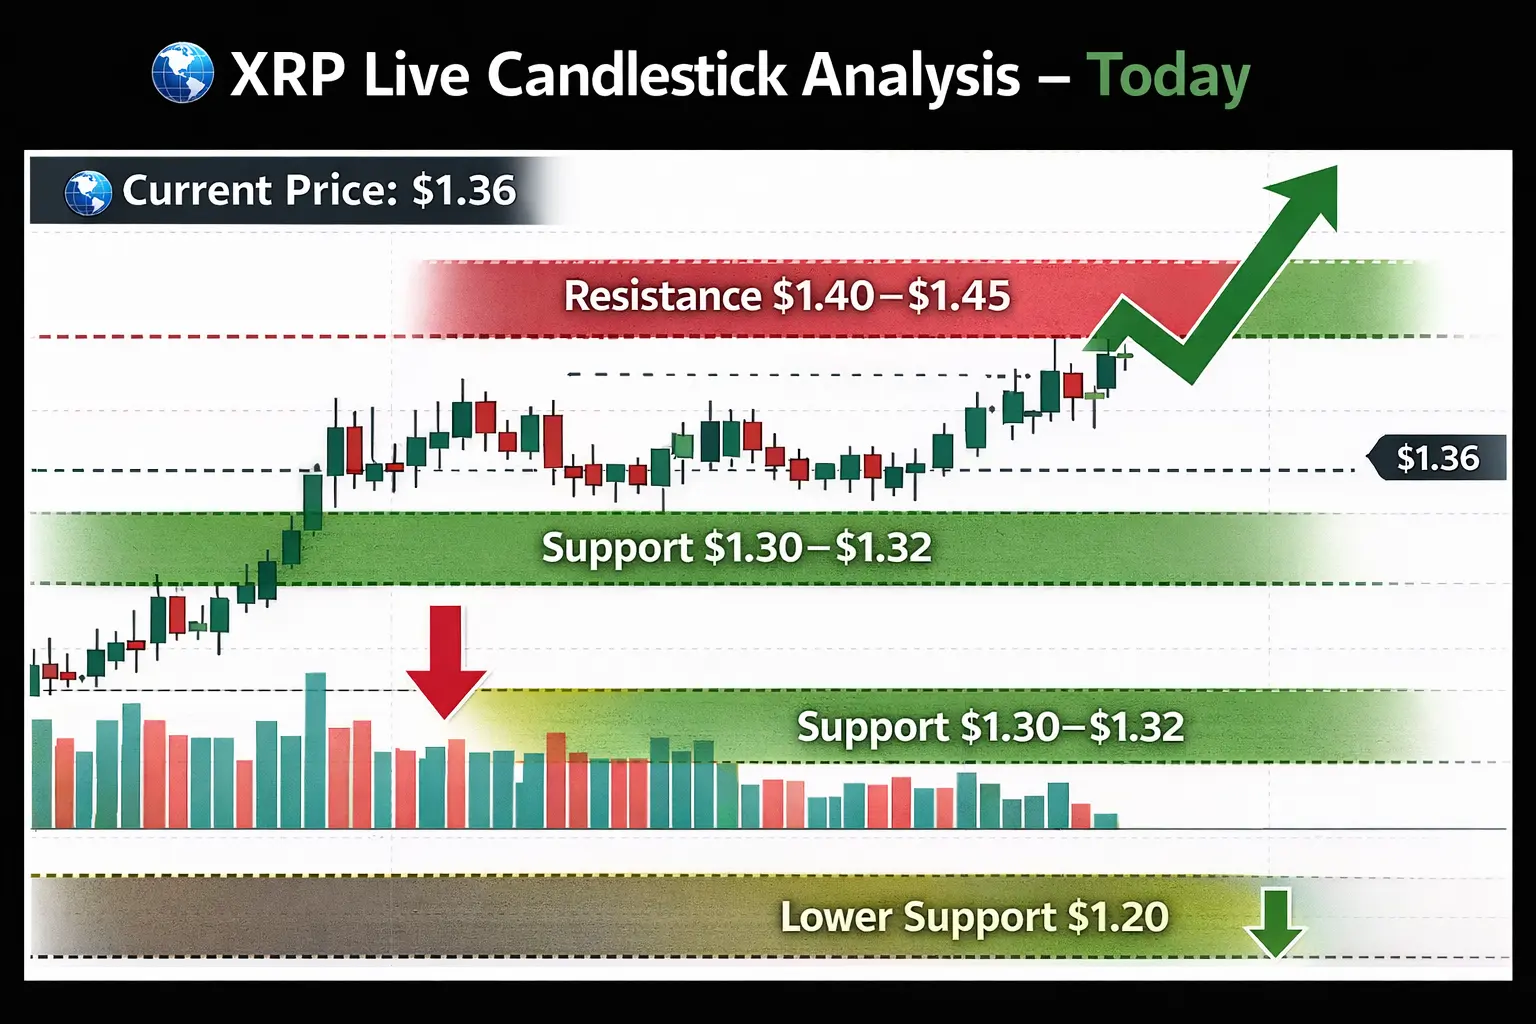
📊 XRP Live Candlestick Analysis – Today
🌐 Current Price: XRP ~ $1.36
XRP is currently trading inside a defined range on the daily timeframe. Recent candles show moderate volatility with mixed momentum, suggesting the market is waiting for a clear directional move.
---
🕯️ Candle Structure Observations
Support Zone: $1.30–$1.32
→ Buyers have stepped in multiple times in this area
Lower Support: $1.20
→ Next downside level if the range breaks
Resistance Zone: $1.40–$1.45
→ Sellers previously rejected price here
Breakout Target: $1.55–$1.60
→ Potential upside move if resistance flips to support
XRP2,27%
- Reward
- like
- Comment
- Repost
- Share
$XRP Gaining Momentum – Is a Big Move Coming? ⚡
XRP ($XRP) is showing renewed strength as market confidence slowly returns. After a period of consolidation, price action is tightening near key resistance levels — a sign that volatility may expand soon.
With growing adoption in cross-border payments and improving regulatory clarity, long-term sentiment around XRP is stabilizing. If buyers push through resistance with strong volume, we could see a sharp upside move. However, failure to break out may lead to another short-term pullback before continuation.
Smart traders are watching liquidity zon
XRP2,27%
- Reward
- 2
- Comment
- Repost
- Share
$XRP Gaining Momentum – Is a Big Move Coming? ⚡
XRP ($XRP) is showing renewed strength as market confidence slowly returns. After a period of consolidation, price action is tightening near key resistance levels — a sign that volatility may expand soon.
With growing adoption in cross-border payments and improving regulatory clarity, long-term sentiment around XRP is stabilizing. If buyers push through resistance with strong volume, we could see a sharp upside move. However, failure to break out may lead to another short-term pullback before continuation.
Smart traders are watching liquidity zon
XRP ($XRP) is showing renewed strength as market confidence slowly returns. After a period of consolidation, price action is tightening near key resistance levels — a sign that volatility may expand soon.
With growing adoption in cross-border payments and improving regulatory clarity, long-term sentiment around XRP is stabilizing. If buyers push through resistance with strong volume, we could see a sharp upside move. However, failure to break out may lead to another short-term pullback before continuation.
Smart traders are watching liquidity zon
XRP2,27%
- Reward
- 1
- Comment
- Repost
- Share
📉🔥 #95%ofAltsBelow200-daySMA – What It Signals for the Crypto Market
The majority of altcoins are currently trading below their 200-day Simple Moving Average (SMA) — a key long-term trend indicator. When nearly 95% of alts sit under this level, it reflects broad market weakness and cautious sentiment.
📊 What Is the 200-Day SMA?
The 200-day SMA is a widely used indicator that smooths price data over 200 days to identify the long-term trend.
📈 Price above 200-day SMA → Bullish long-term structure
📉 Price below 200-day SMA → Bearish long-term structure
When most altcoins remain below this le
- Reward
- 1
- Comment
- Repost
- Share
#95%ofAltsBelow200-daySMA
#95%ofAltsBelow200DaySMA 📉
Nearly 95% of altcoins are now trading below their 200-day simple moving average — a clear signal that the broader market remains under long-term bearish pressure. When assets sit beneath this key technical level, it reflects weakened momentum, reduced investor confidence, and sustained distribution phases.
The 200-day SMA is widely viewed as a macro trend indicator. Trading below it often suggests that rallies may face resistance unless accompanied by strong volume expansion and improving market structure. For seasoned traders, this envi

- Reward
- 10
- 17
- Repost
- Share
ShainingMoon:
To The Moon 🌕View More
Load More
Join 40M users in our growing community
⚡️ Join 40M users in the crypto craze discussion
💬 Engage with your favorite top creators
👍 See what interests you
Trending Topics
350.62K Popularity
101.58K Popularity
185.5K Popularity
10.96M Popularity
16.91K Popularity
3.14K Popularity
27.08K Popularity
545.2K Popularity
19.3K Popularity
376.28K Popularity
54.12K Popularity
85.04K Popularity
13.49K Popularity
30.83K Popularity
19.09K Popularity
News
View MoreData: If BTC drops below $65,668, the total long liquidation strength on mainstream CEXs will reach $1.679 billion.
36 m
Data: If ETH falls below $1,931, the total long liquidation strength on mainstream CEXs will reach $1.135 billion.
37 m
ETH 15-minute sharp decline of 1.23%: leveraged long liquidations and on-chain capital outflows resonate, intensifying volatility
1 h
BTC short-term decline of 0.81%: Futures long liquidation wave triggers passive selling and liquidity resonance, intensifying volatility
1 h
BTC drops below 69,000 USDT
1 h
Pin