
The Injective price has fallen sharply from its previous all-time high, leading some traders to question whether the project has lost its momentum.
However, a recent technical analysis shared by top analyst Crypto Patel suggests that the recent decline may actually represent a typical market reset rather than the end of the project’s growth potential.
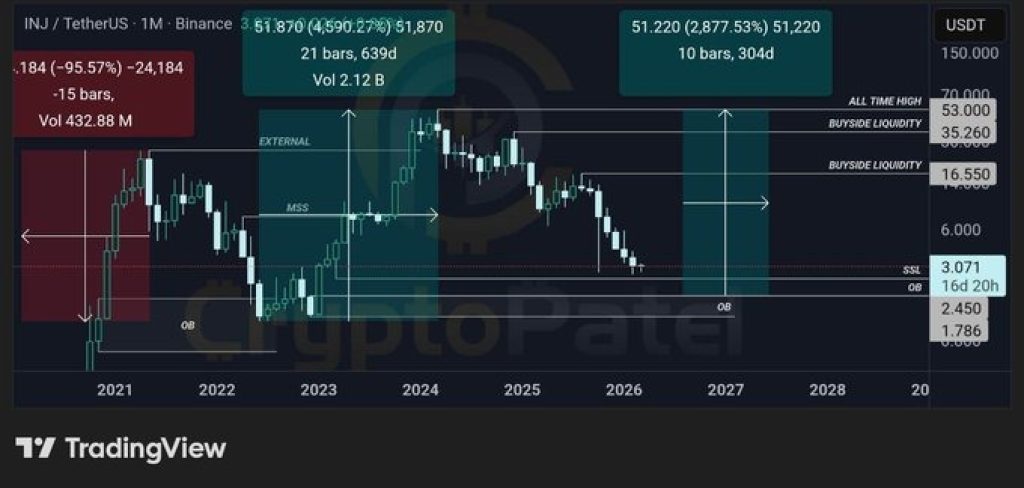
According to the analysis, the INJ price has corrected by roughly 95% from its peak, a move that often happens during major crypto cycles.
Such steep corrections usually clear out late buyers and excess liquidity from the market, allowing stronger long-term accumulation to take place. In many cases, this type of reset creates conditions for the next large price expansion once the market structure stabilizes.
Here’s What The INJ Chart Is Showing
Looking at the monthly timeframe, the chart shows that the INJ price tapped into a monthly order block, which represents a high-timeframe demand zone where institutional buying activity can appear.
These zones are closely watched by traders because they often mark areas where large investors previously accumulated positions.
After reaching this demand zone, the chart reportedly showed a powerful impulsive expansion of around 4500%, suggesting a strong reaction from buyers at that level.
This type of displacement is often interpreted as confirmation that the order block is valid and that significant demand exists in that price region.
The analysis also highlights a Market Structure Shift (MSS) on the macro chart. A structure shift like this can signal that the long-term trend is beginning to change. If this new structure holds and the market continues forming higher lows over time, it could strengthen the case for a larger recovery move.
Source: X/CryptoPatel
Liquidity Targets Point to Large Upside Potential For INJ price
If the broader market structure remains intact, the chart suggests several potential upside liquidity targets for INJ in the longer term.
The first key level sits around $16, followed by higher targets near $35 and $53, which correspond to areas where liquidity may exist on the chart.
Achieving those levels from current levels is a potential move of more than 2800%, as per the analysis.
_****AI Predicts Where ADA Price Is Headed Next After Cardano’s Technical Flip**
However, the move is said to be a gradual process, and traders are advised to look out for confirmation signals before entering into a trade.
The strategy that is being used in the analysis is one of patience. Waiting for higher lows to be established on a weekly chart is said to be a confirmation of the resumption of bullish momentum.
Also, looking out for a Change in State of Delivery (CISD) on a pullback is said to be a clearer entry point when the market is said to be trending upwards.
For now, however, while the cryptocurrency has indeed experienced a severe correction, the INJ chart does seem to suggest it may be entering a long-term accumulation phase, which may eventually lead to the next major move. As with all technical analysis, it should be noted that such a move is purely speculative, and research should be done before investing.
Disclaimer: The information on this page may come from third parties and does not represent the views or opinions of Gate. The content displayed on this page is for reference only and does not constitute any financial, investment, or legal advice. Gate does not guarantee the accuracy or completeness of the information and shall not be liable for any losses arising from the use of this information. Virtual asset investments carry high risks and are subject to significant price volatility. You may lose all of your invested principal. Please fully understand the relevant risks and make prudent decisions based on your own financial situation and risk tolerance. For details, please refer to
Disclaimer.
Related Articles
Bitcoin Rebounds to $74K on U.S.-Iran Framework Deal, But Market Skepticism Remains
Bitcoin's recent rise to mid-$74,000 followed a risk asset rally linked to a U.S.-Iran nuclear framework, but skepticism remains due to flat Treasury yields and unchanged gold prices. The core issue of uranium enrichment persists, and while on-chain data shows BTC's gradual advance, options markets reflect doubts about a sustained breakout. Overall, analysts see the rally as temporary, with macro conditions still tight and potential downside risks.
GateNews8h ago
Cardano Traders Watch $0.243 Support Level as ADA Price Faces Critical Decision
Cardano (ADA) is at a crucial support level of $0.243, with potential gains to $0.30 if it holds. A daily close below this could lead to declines toward $0.10. Currently, trading volume is around $500 million, with ADA notably below its all-time high.
GateNews10h ago
ETH/BTC Price Ratio Rebounds to 0.0313 in Q1 2026 as Ethereum User Base Surges 82%
In Q1 2026, the Ethereum-to-Bitcoin price ratio reached a three-month high at 0.0313. Ethereum added 284,000 users and surpassed $180 billion in stablecoin supply. Bitcoin remained strong above $74,000, driven by significant ETF inflows.
GateNews15h ago
Why is Bitcoin up today? Trump says Iran is seeking a truce, and risk assets move higher across the board
On April 15, Bitcoin rebounded about 6% after Trump said Iran is seeking to reach an agreement, breaking above $75,000. Expectations for the resumption of U.S.-Iran negotiations warmed up, lifting Asian stock markets. Technically, roughly $6 billion worth of short positions were forced to close, accelerating the rebound. Analysts said that if the U.S.-Iran situation continues to ease, Bitcoin could break through $80,000, and they predicted it may reach $150,000 by year-end.
MarketWhisper19h ago
Bitmine is promoted to the NYSE main board! Tom Lee: US stocks may be at a bottom, and selling pressure on Ether could ease
Bitmine officially transferred from the NYSE American market to the main board, marking a significant milestone for the company. Despite a sharp drop in its share price, it still increased the share repurchase program to $4 billion. The company holds a large amount of Ether, and expects that a rebound in the crypto market will help improve its assets and share price performance.
CryptoCity19h ago
ETH 15-minute up 0.66%: On-chain large transfers in sync drove a net inflow of funds, boosting spot buying pressure
2026-04-15 00:00 to 00:15 (UTC), ETH shows a local anomaly. The 15-minute return rate is +0.66%. The trading price range is 2321.93–2343.2 USDT, with a range of 0.92%. During this period, market attention increased, volatility slightly intensified, buy pressure in the order book shifted upward in the short term, and quickly pushed spot prices up into a key resistance area.
The main drivers of this anomaly are large on-chain transfers and inflows of capital in combination. At the beginning of the window, multiple large ETH transfers appeared, including 8,676 ETH and 6,551 ETH, respectively, transferring from a large source to the
GateNews19h ago
